Refreshed Nov 11, 2026

The hooks, angles and offers behind Trendtrack.io’s Facebook and Instagram ads, filed by format and niche.

Live on Meta nowOn Trendtrack.io’s Meta page
182
Median runHow long its ads stay up
6 days
Against App / SoftwareNiche median 19 days
0.3×

The messages Trendtrack.io keeps paying for

Same idea, new creatives

  • “Le combo Trendtrack + Claude c'est du jamais vu”

    2 ads
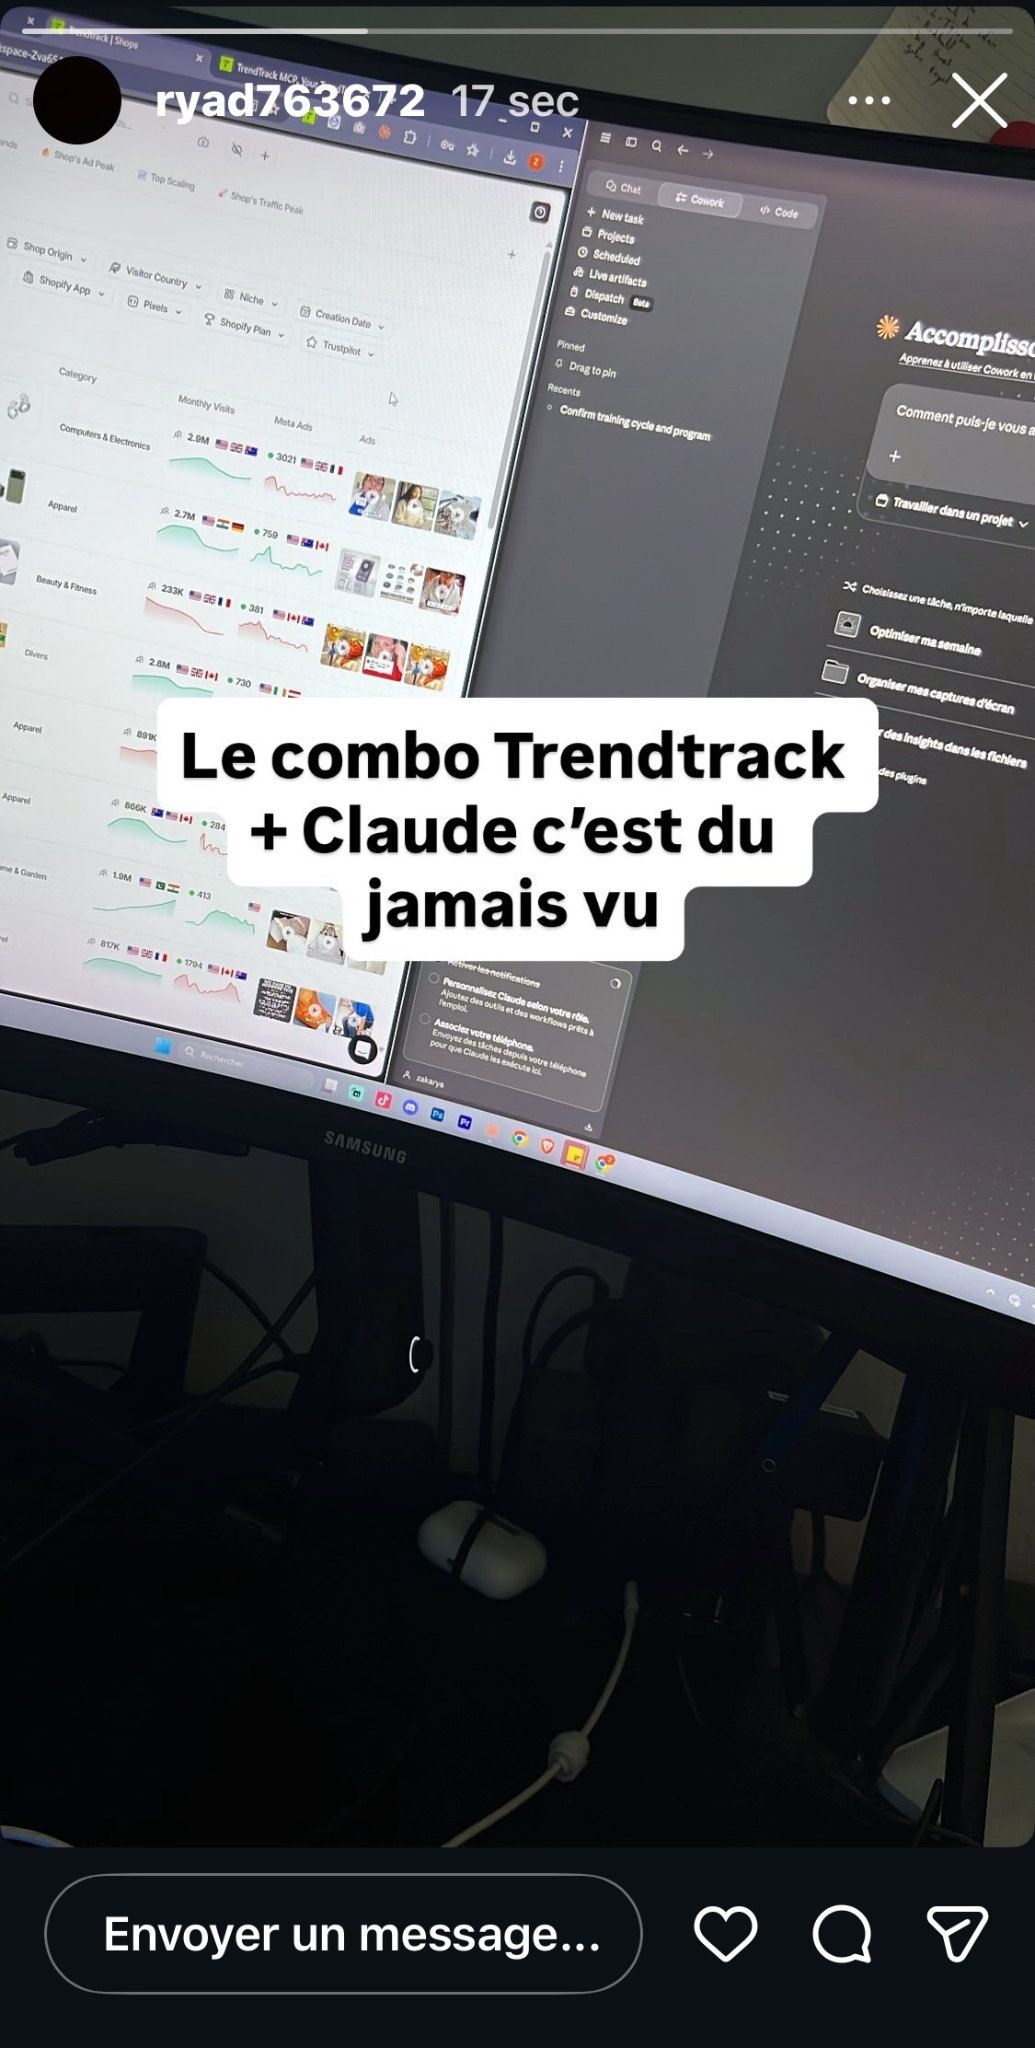
    Trendtrack.io ad: “Le combo Trendtrack + Claude c'est du jamais vu”

    Running since Oct 2026.

  • “la recherche:”

    2 ads

    Running since Nov 2026.

How Trendtrack.io builds them

53 ads

What Trendtrack.io's ads are made of, row by row.

Free with an account.

Longest running

All 53

The Trendtrack.io ads that ran longest.

Free with an account.

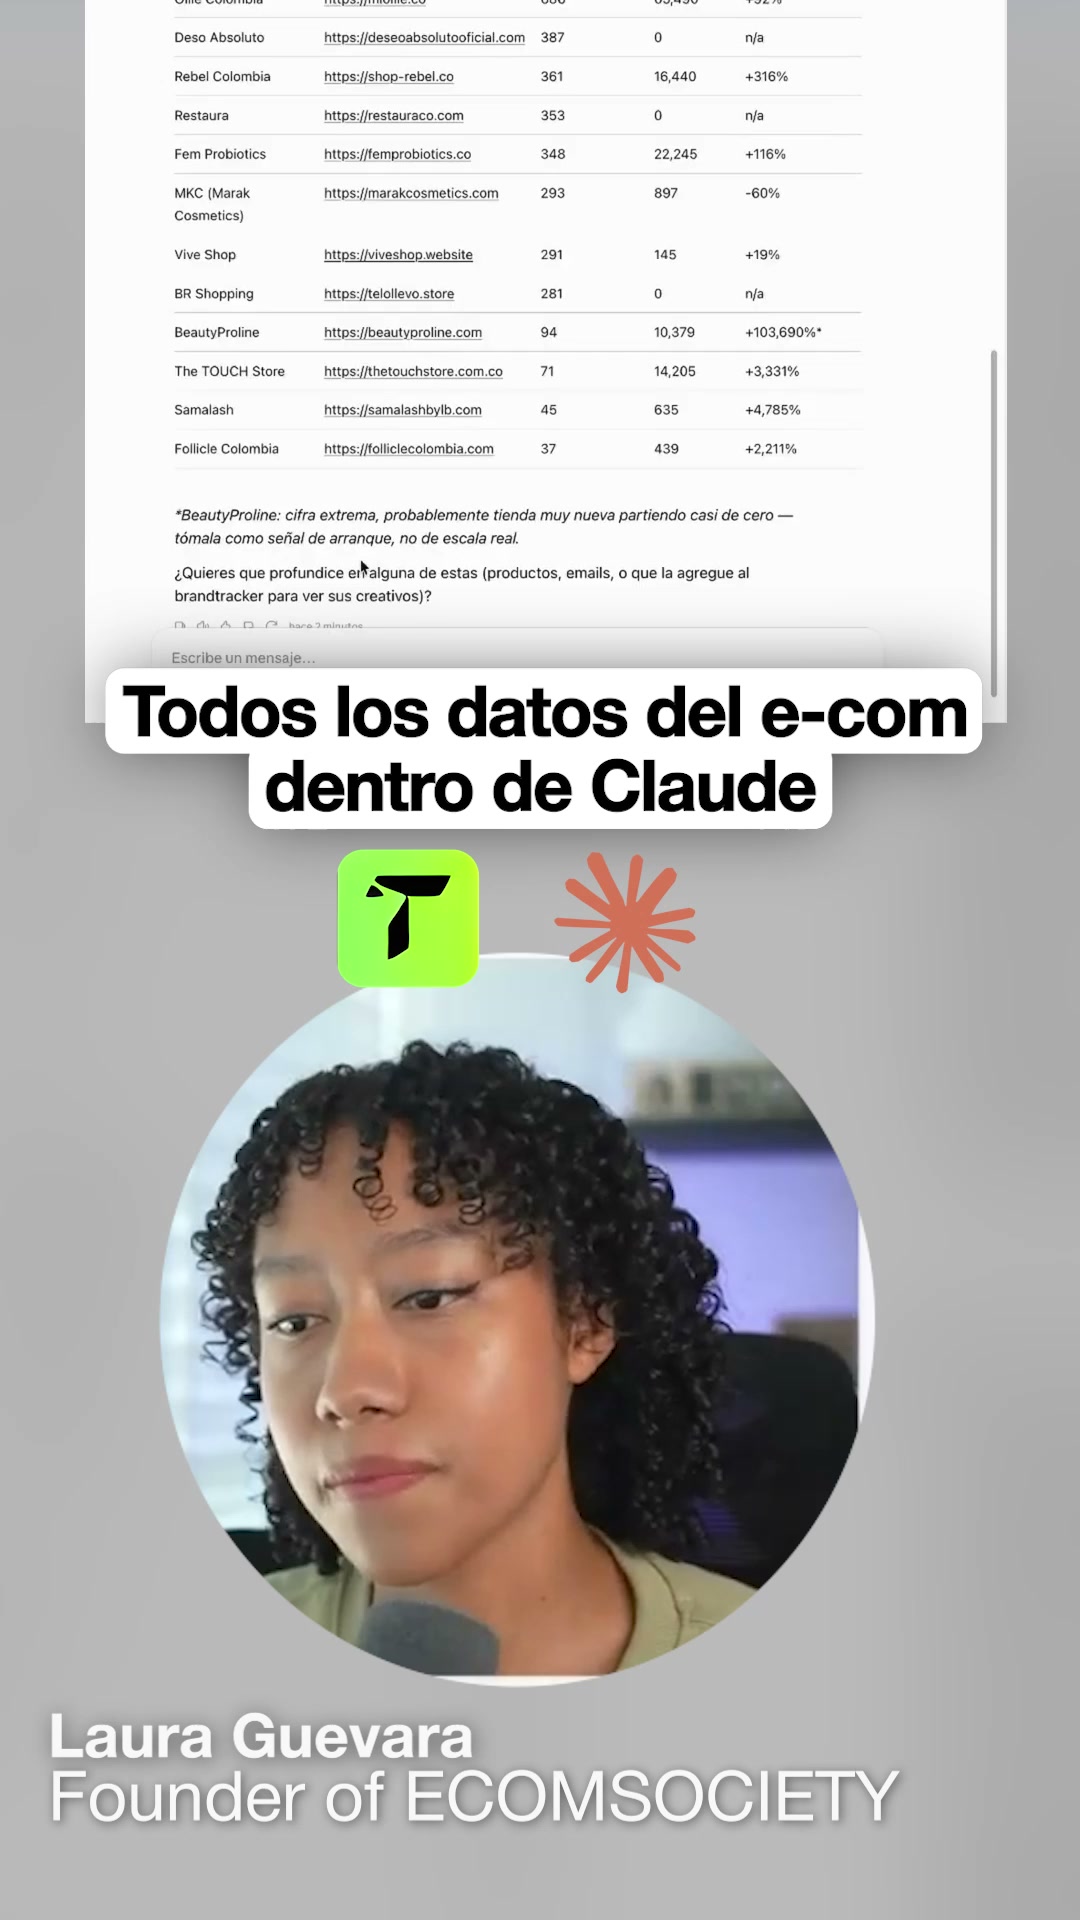
The video displays a table of e-commerce data, followed by a question prompt. A woman's face is visible in a circular overlay at the bottom. The text asks if the viewer wants to delve deeper into specific products, emails, or add them to a brand tracker for creative analysis. The table shows product names, stores, and relevance signals.
Active · 30 daysVideo
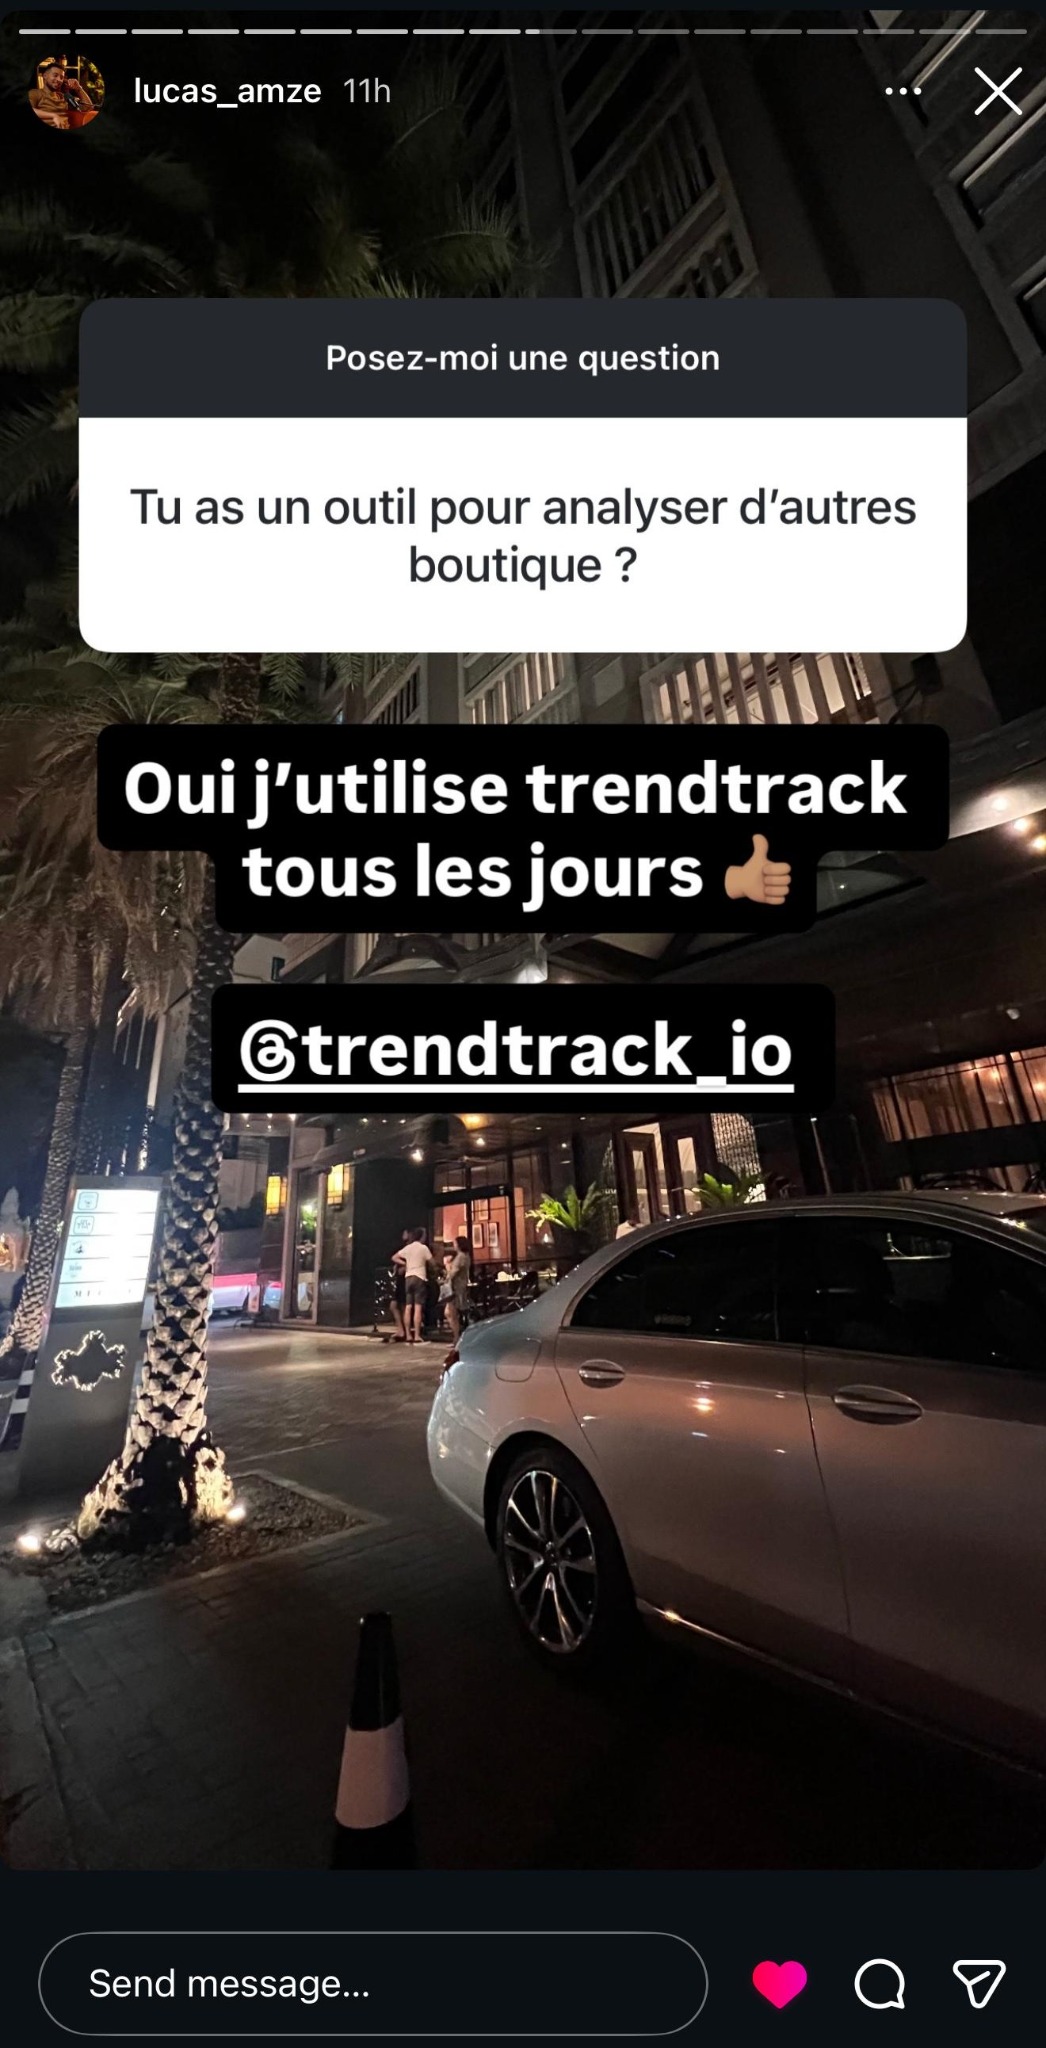
This creative is a screenshot of an Instagram Story Q&A sticker. The background shows a dimly lit outdoor scene at night with a car parked in front of a building. A question box is at the top, followed by a black text box with white text answering the question, and a final black box containing the brand's handle.
Active · 30 days
A screen recording shows a computer desktop with two browser windows open side-by-side. The left window displays the Trendtrack dashboard with various data metrics and charts, while the right window shows the Claude AI interface. A large white text box is centered over the screen, containing the hook in French.
Active · 30 days
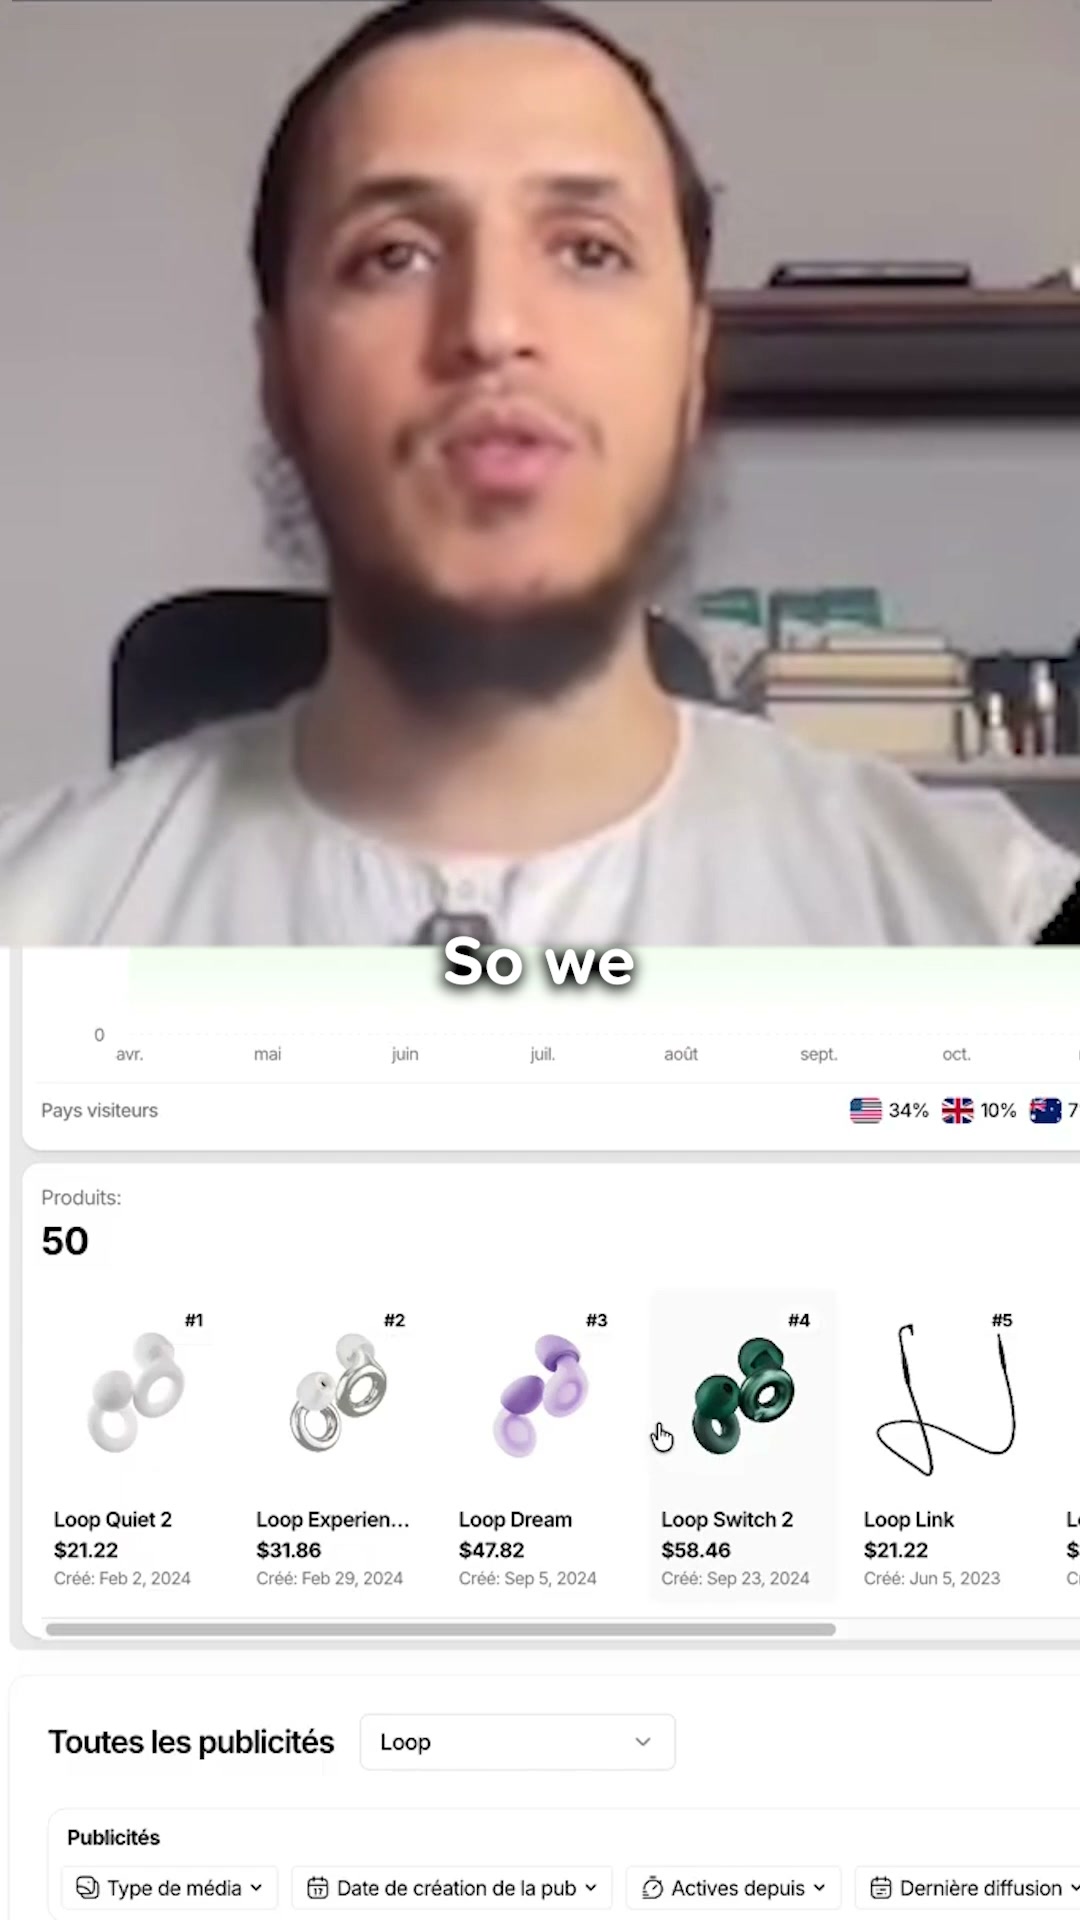
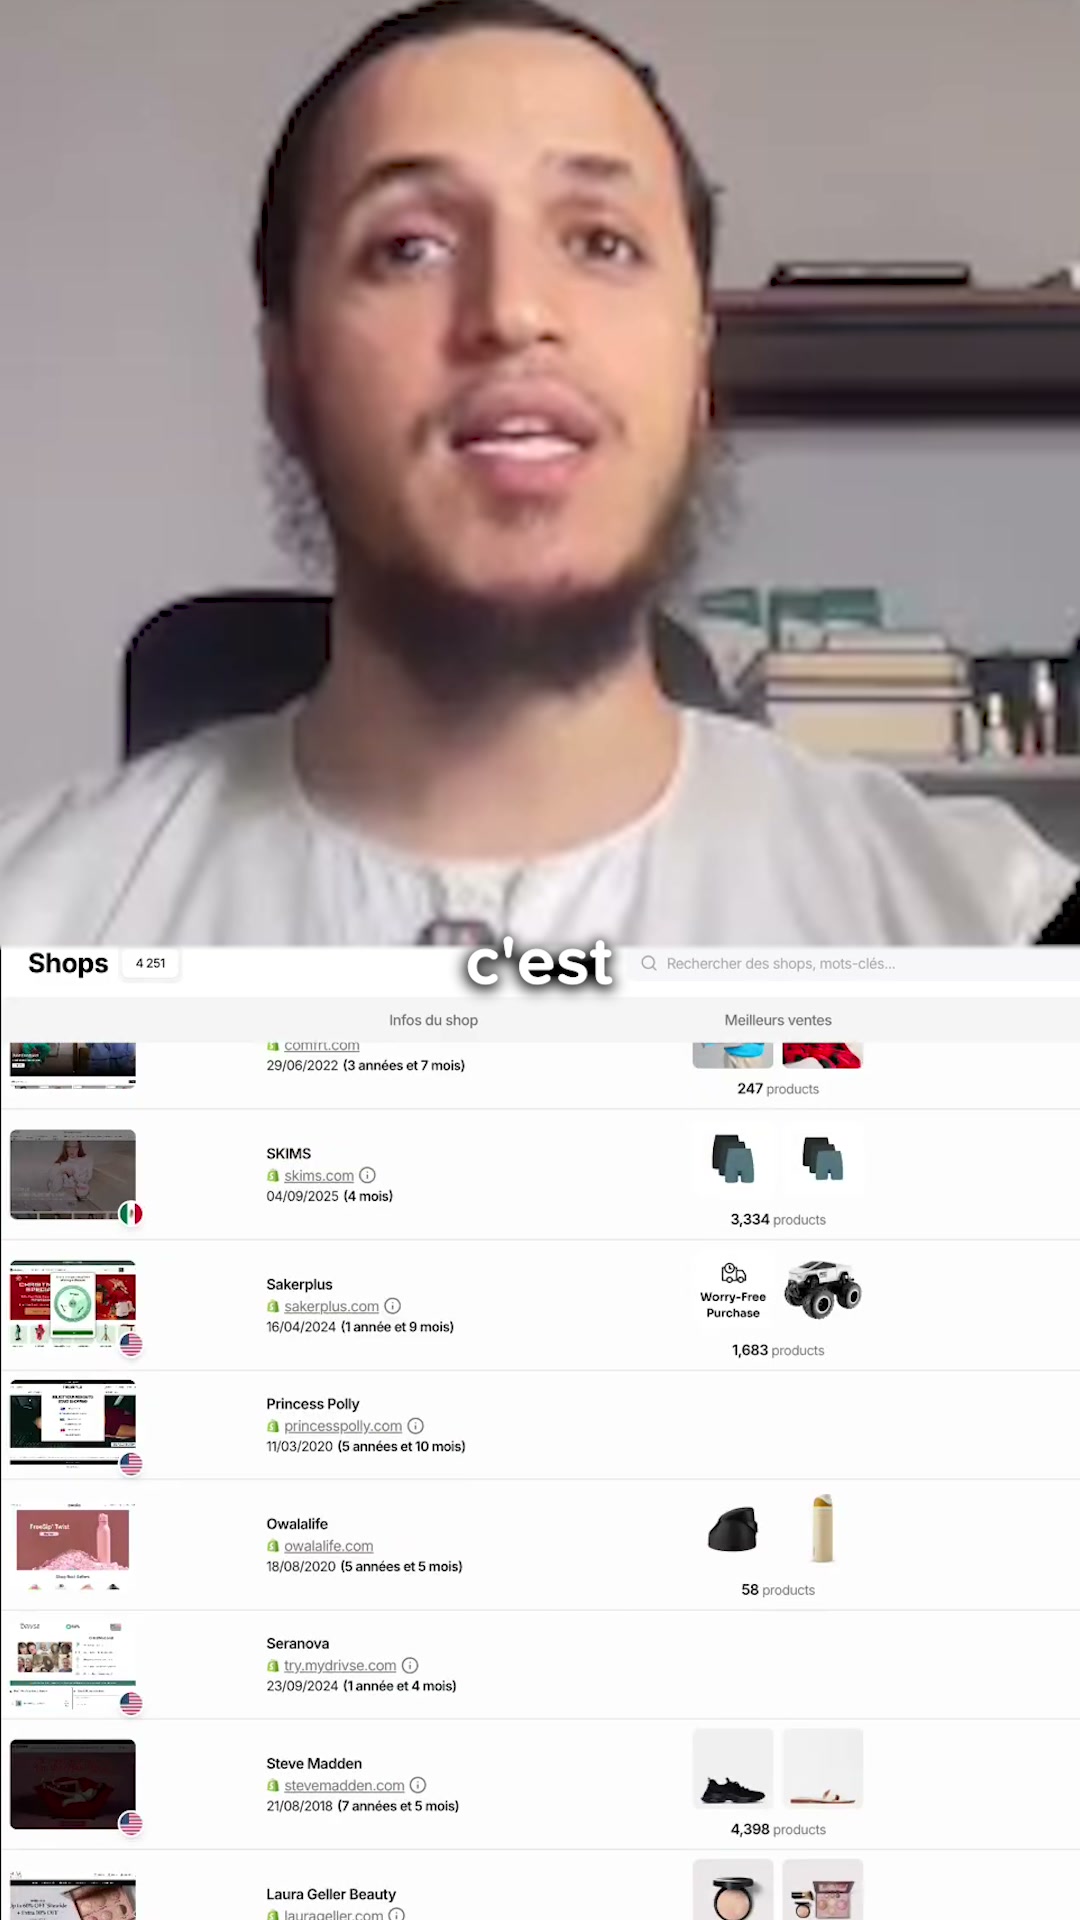
A man is shown on screen, talking directly to the camera. The background displays a screen recording of a website interface, showing analytics for an e-commerce shop. The video analyzes website traffic, ad performance, and best-selling products, offering insights into scaling strategies. The hook is a question about analyzing scaling shops.
Active · 30 daysVideo
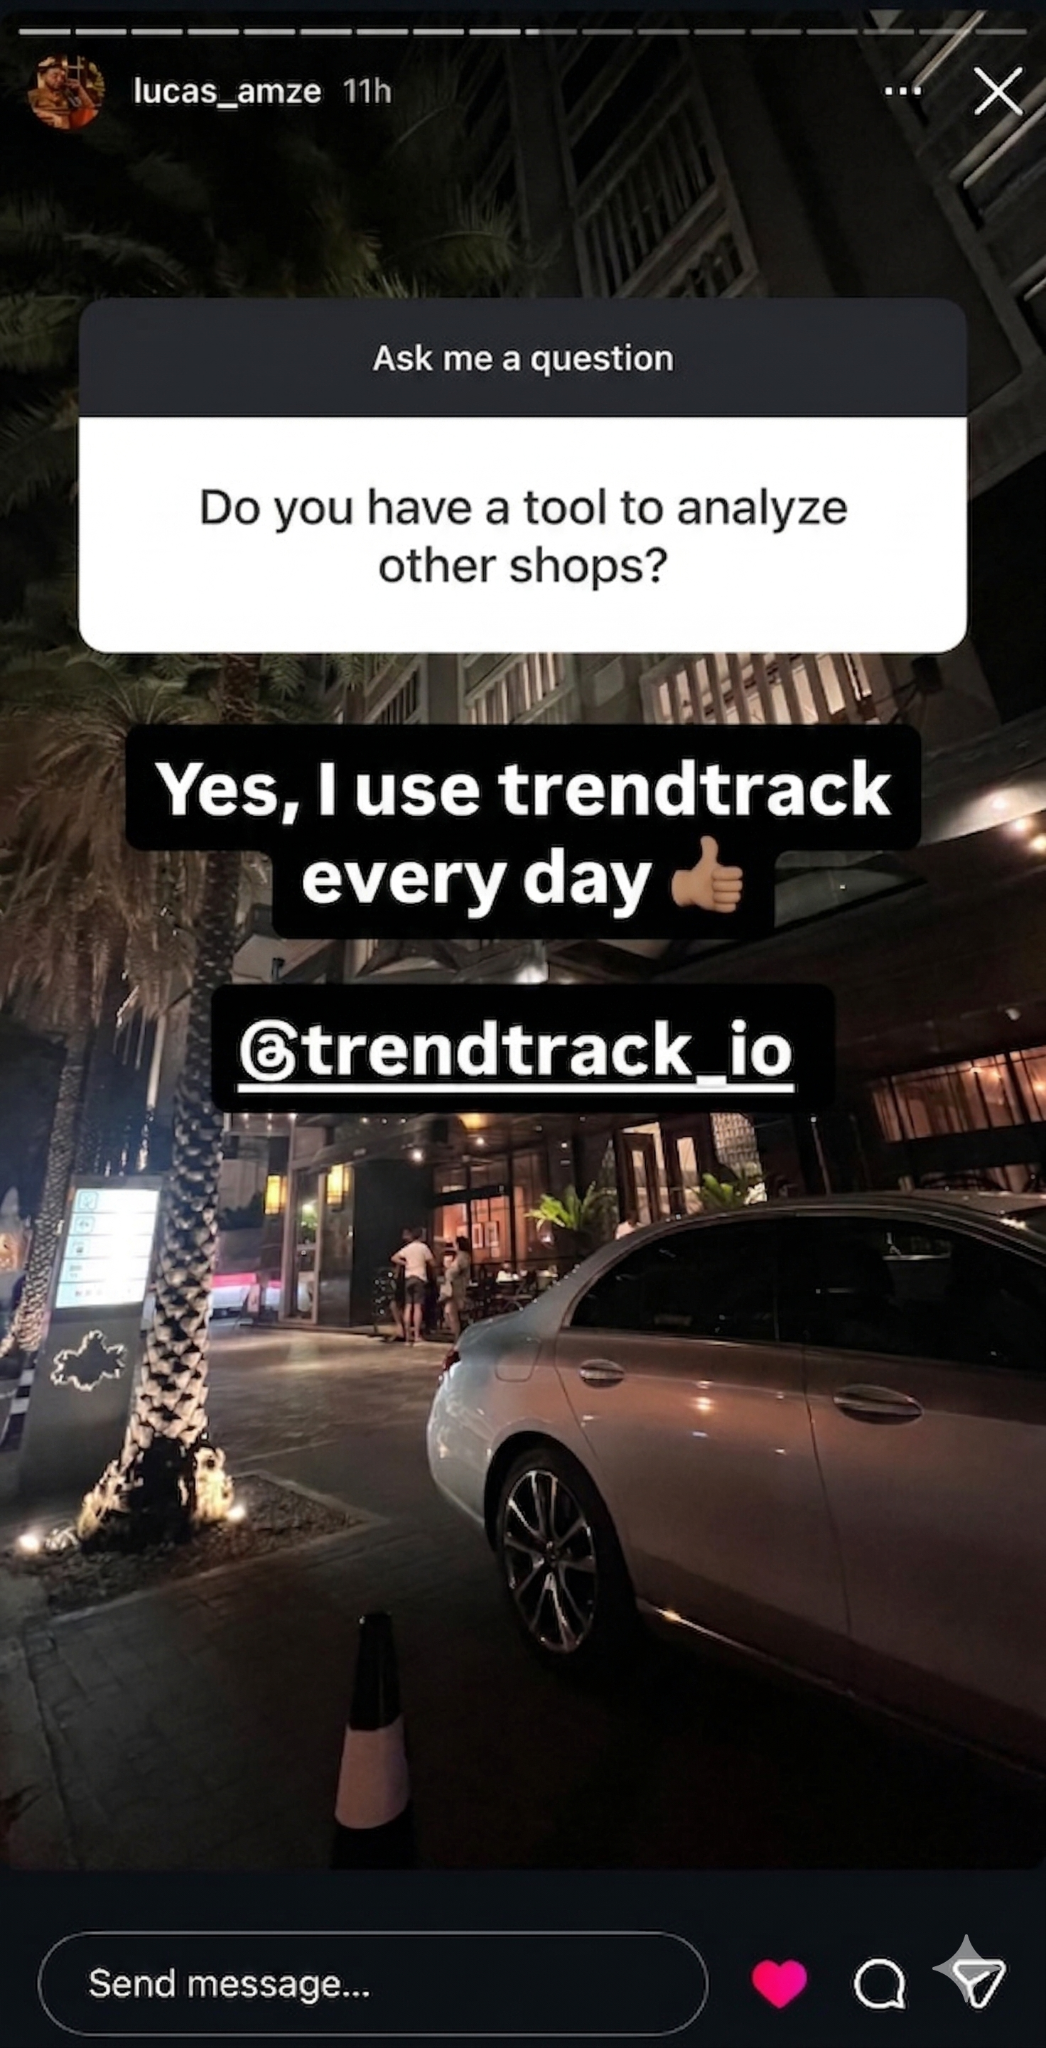
This is a screenshot of an Instagram Story featuring an 'Ask me a question' sticker. The question asks if the user has a tool to analyze other shops. The response, written in a black text box, confirms the use of a specific tool daily and includes the brand's handle. The background is a dimly lit outdoor scene at night with a car parked in front of a building.
Active · 30 days
A man is shown on screen, talking to the camera. The background shows a website interface with filters and shop data. Text overlays explain how to use the filters to find successful e-commerce shops. The video demonstrates how to filter by visitor country and active ads to identify potential competitors or products. The focus is on practical steps for market research.
Active · 30 daysVideo
The video shows a person's hand pointing to different app logos as they are mentioned. Text overlays appear on screen with the names of the apps and instructions. The apps shown are Claude, Trendtrack, Shopify, Higgsfield, Meta, and TikTok Ads. The video demonstrates how to connect these apps to create product pages and launch advertising.
Active · 30 daysVideo
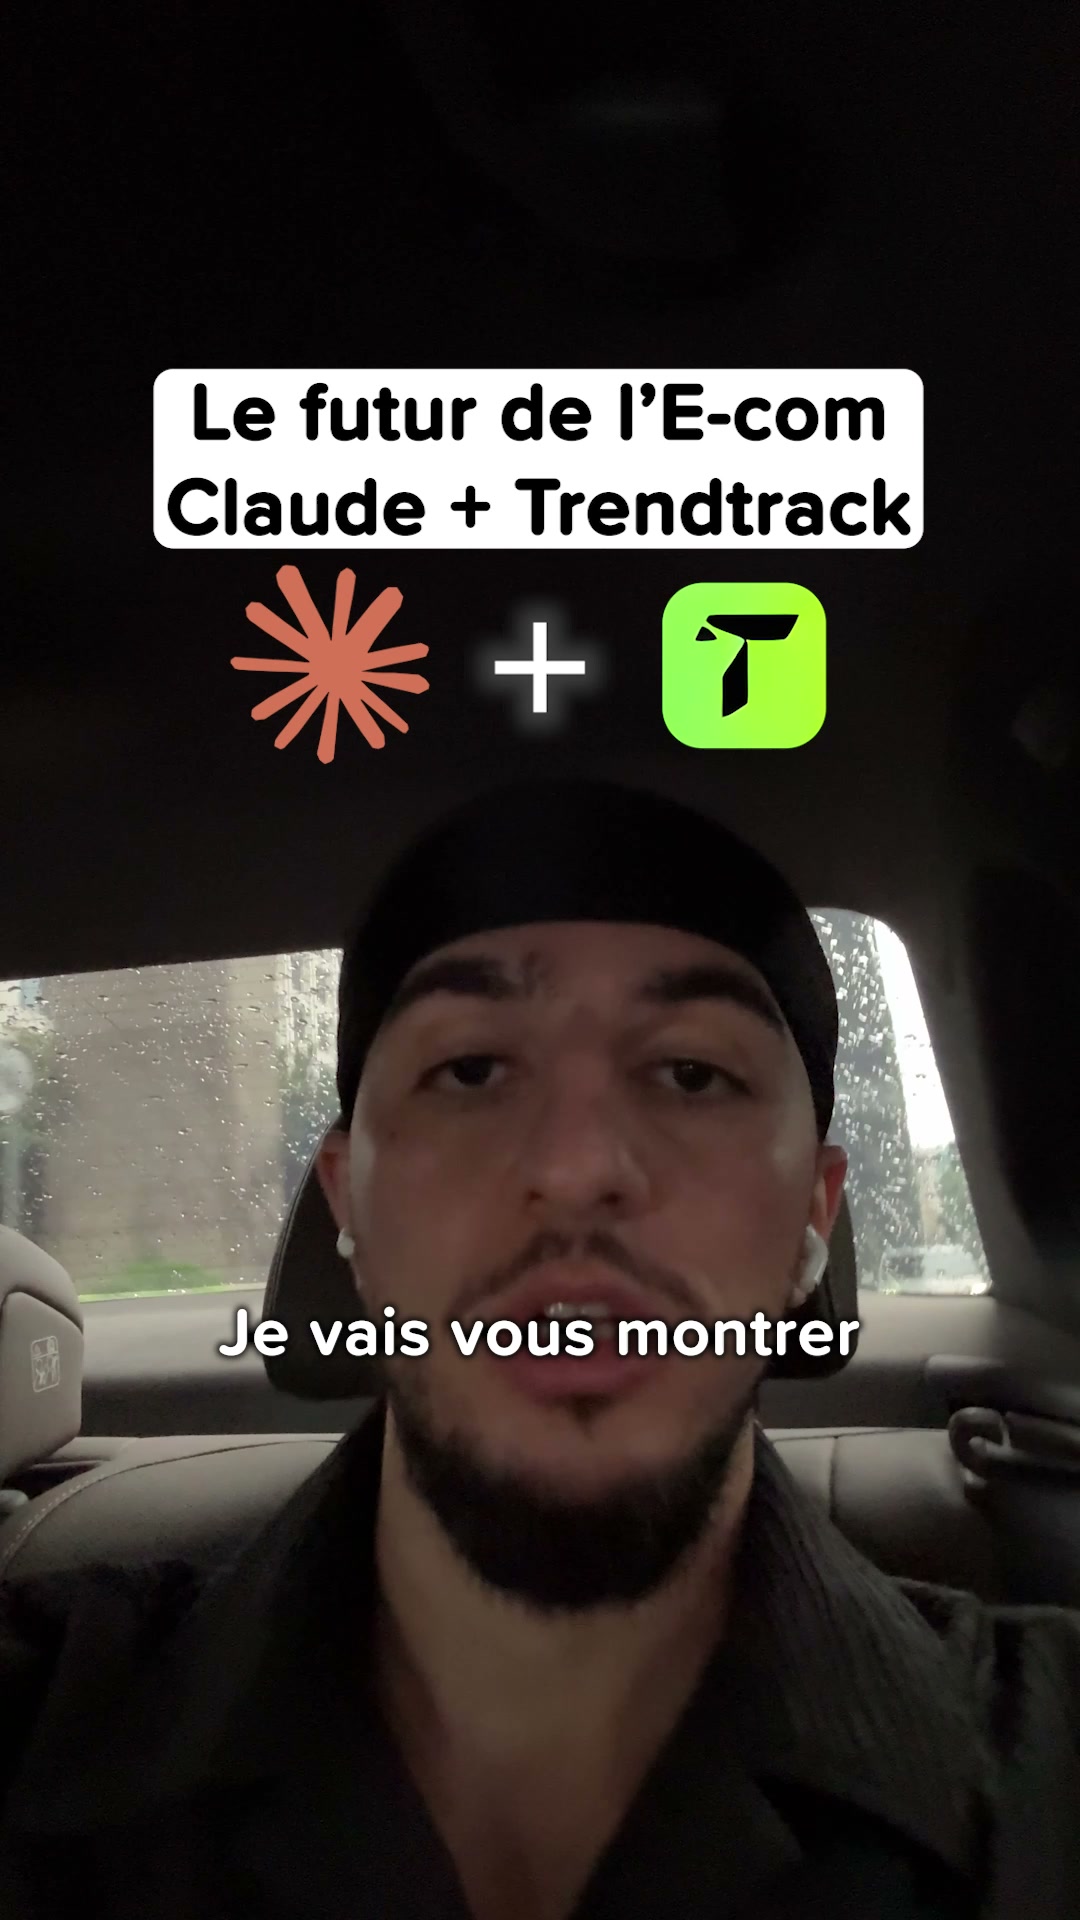
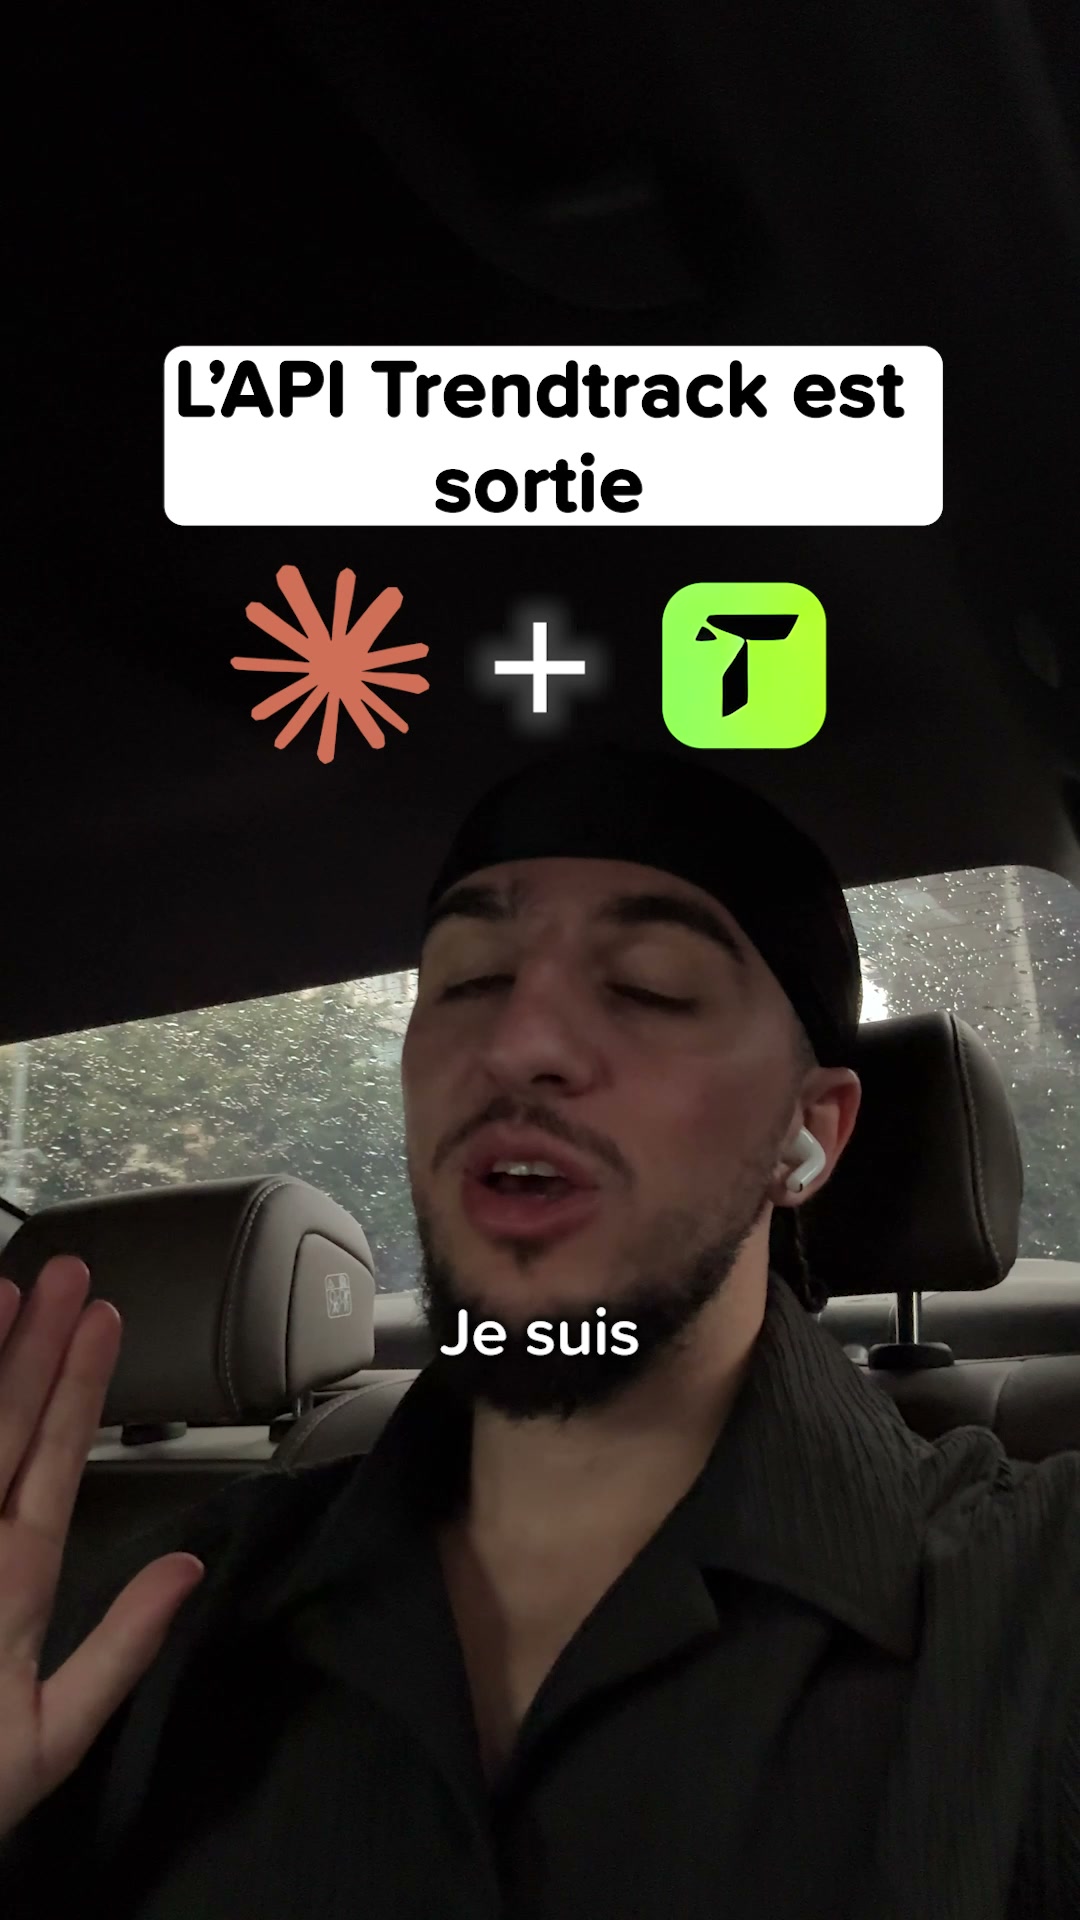
A man in a car explains how to connect Trendtrack to Claude. He then shows a laptop screen with the Trendtrack website and the Claude interface, demonstrating the connection process step-by-step. The video concludes with a demonstration of a prompt being sent to Claude using Trendtrack data.
Active · 30 daysVideo
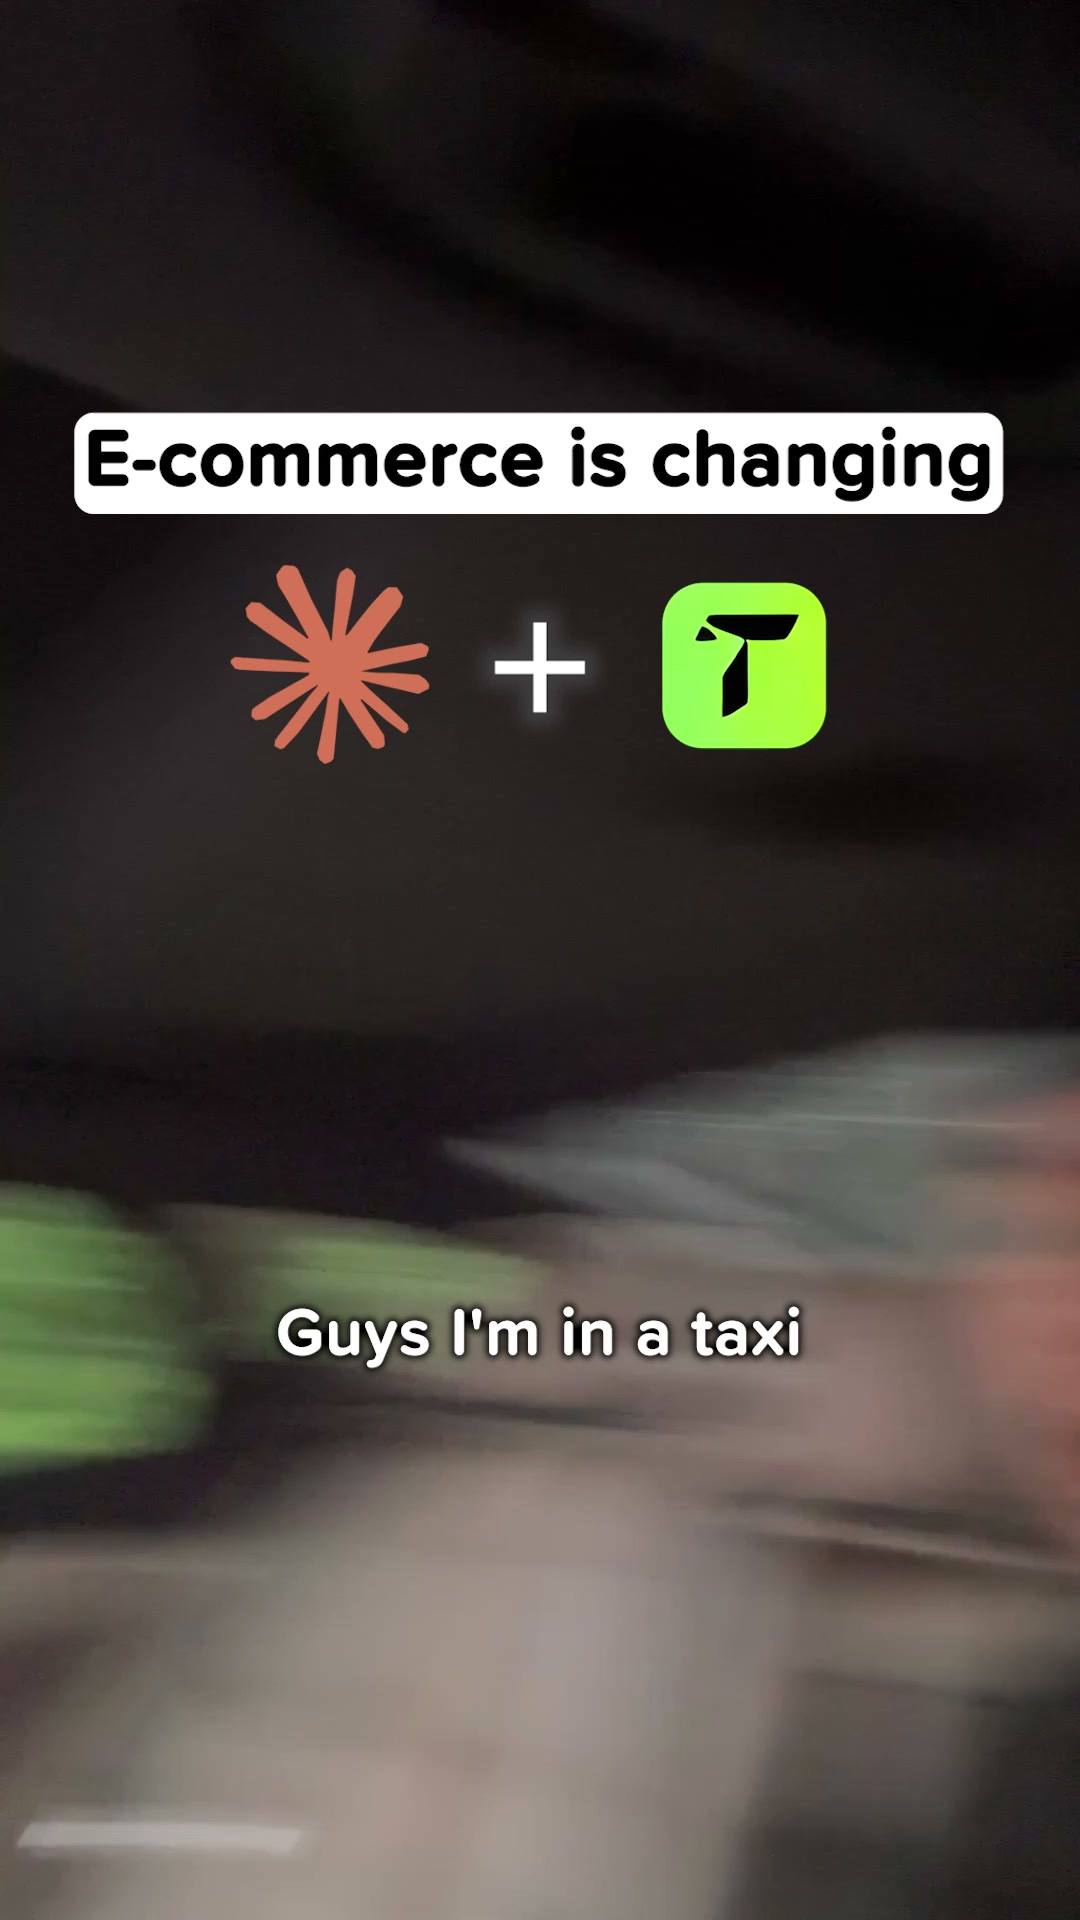
The video starts with text overlay on a car interior, stating "E-commerce is changing" and showing two logos. A man in the car then explains how Trendtrack has released an API with Claude. He demonstrates how to connect Trendtrack to Claude via their website, showing the steps to add a custom connector and then how to use it to analyze product data and competition. The video highlights the power of this integration for e-commerce business owners.
Active · 30 daysVideo
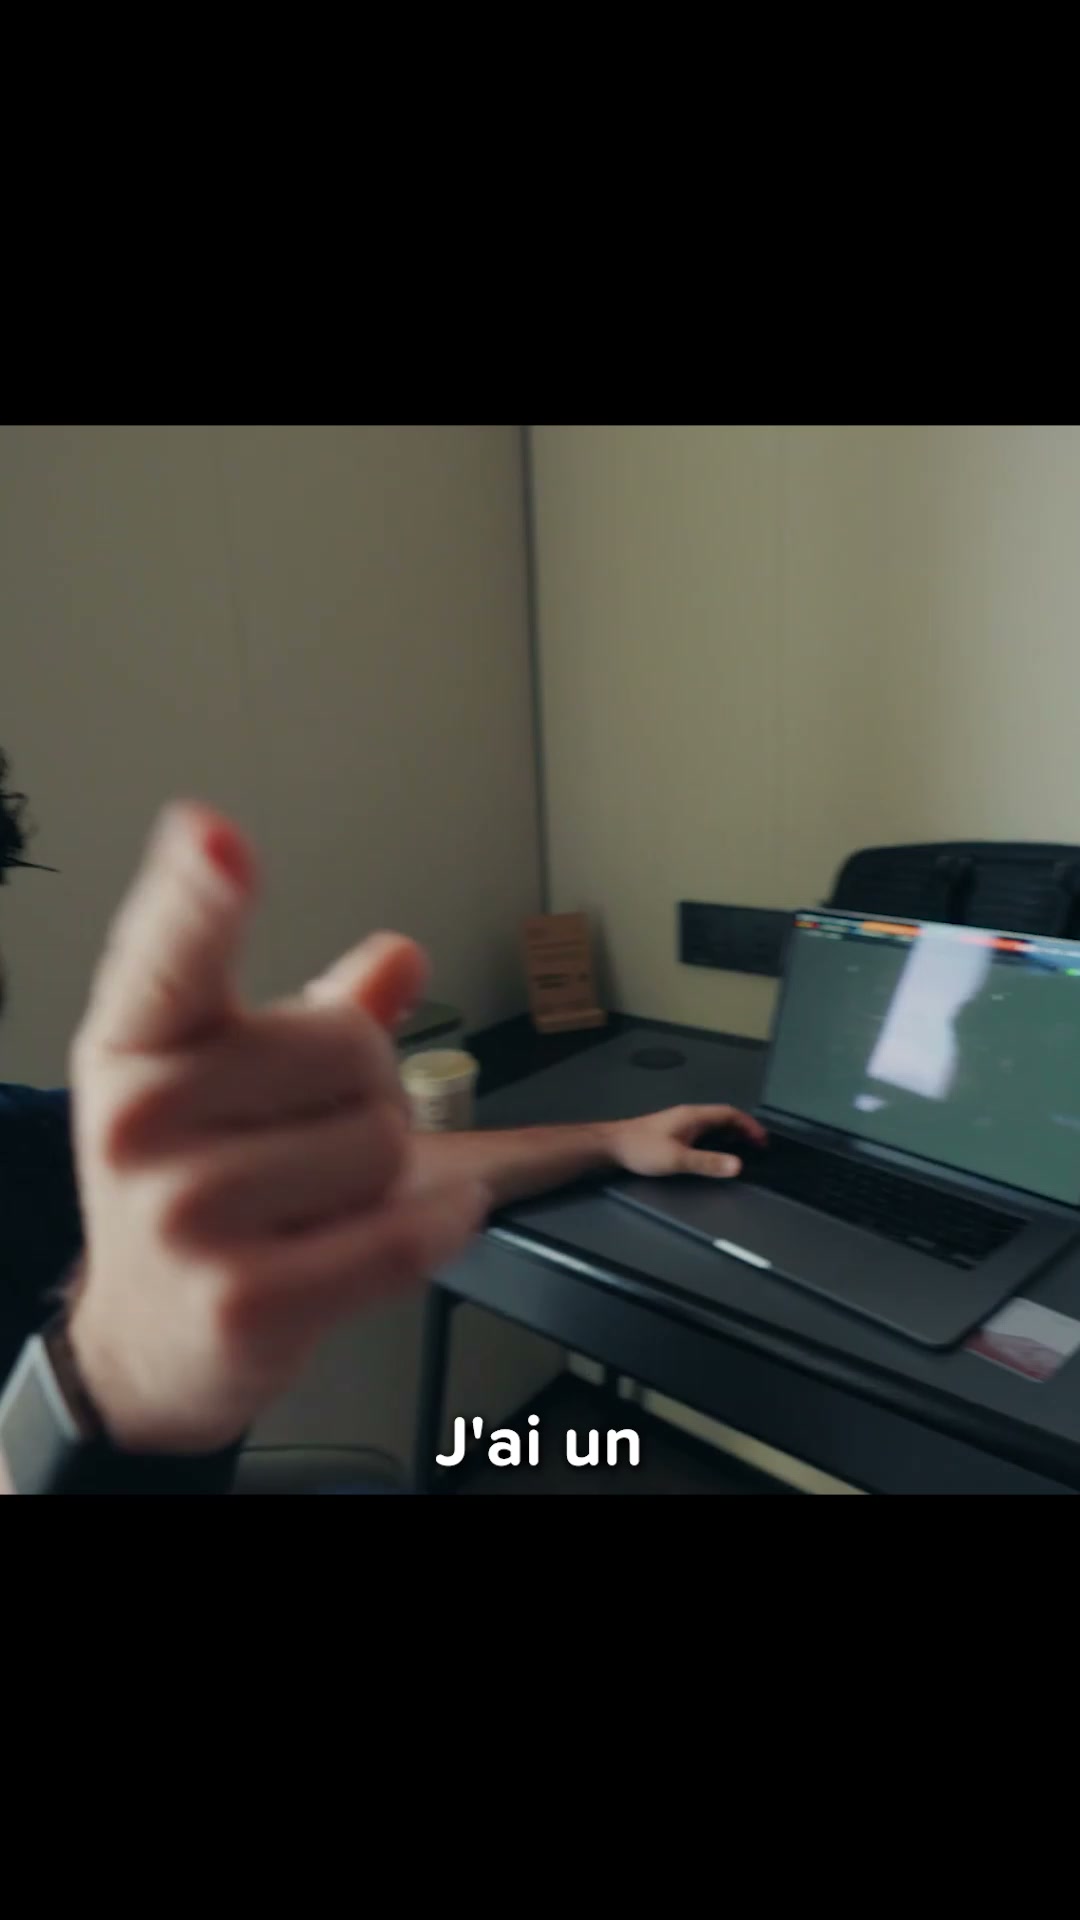
A man is sitting at a desk in front of a laptop, demonstrating a web application. He points to the screen and gestures with his hands as he explains the features. The application appears to be a dashboard for tracking marketing data, showing emails, ads, and competitor information. The video focuses on the functionality of the tool, with text overlays explaining its purpose.
Active · 30 daysVideo
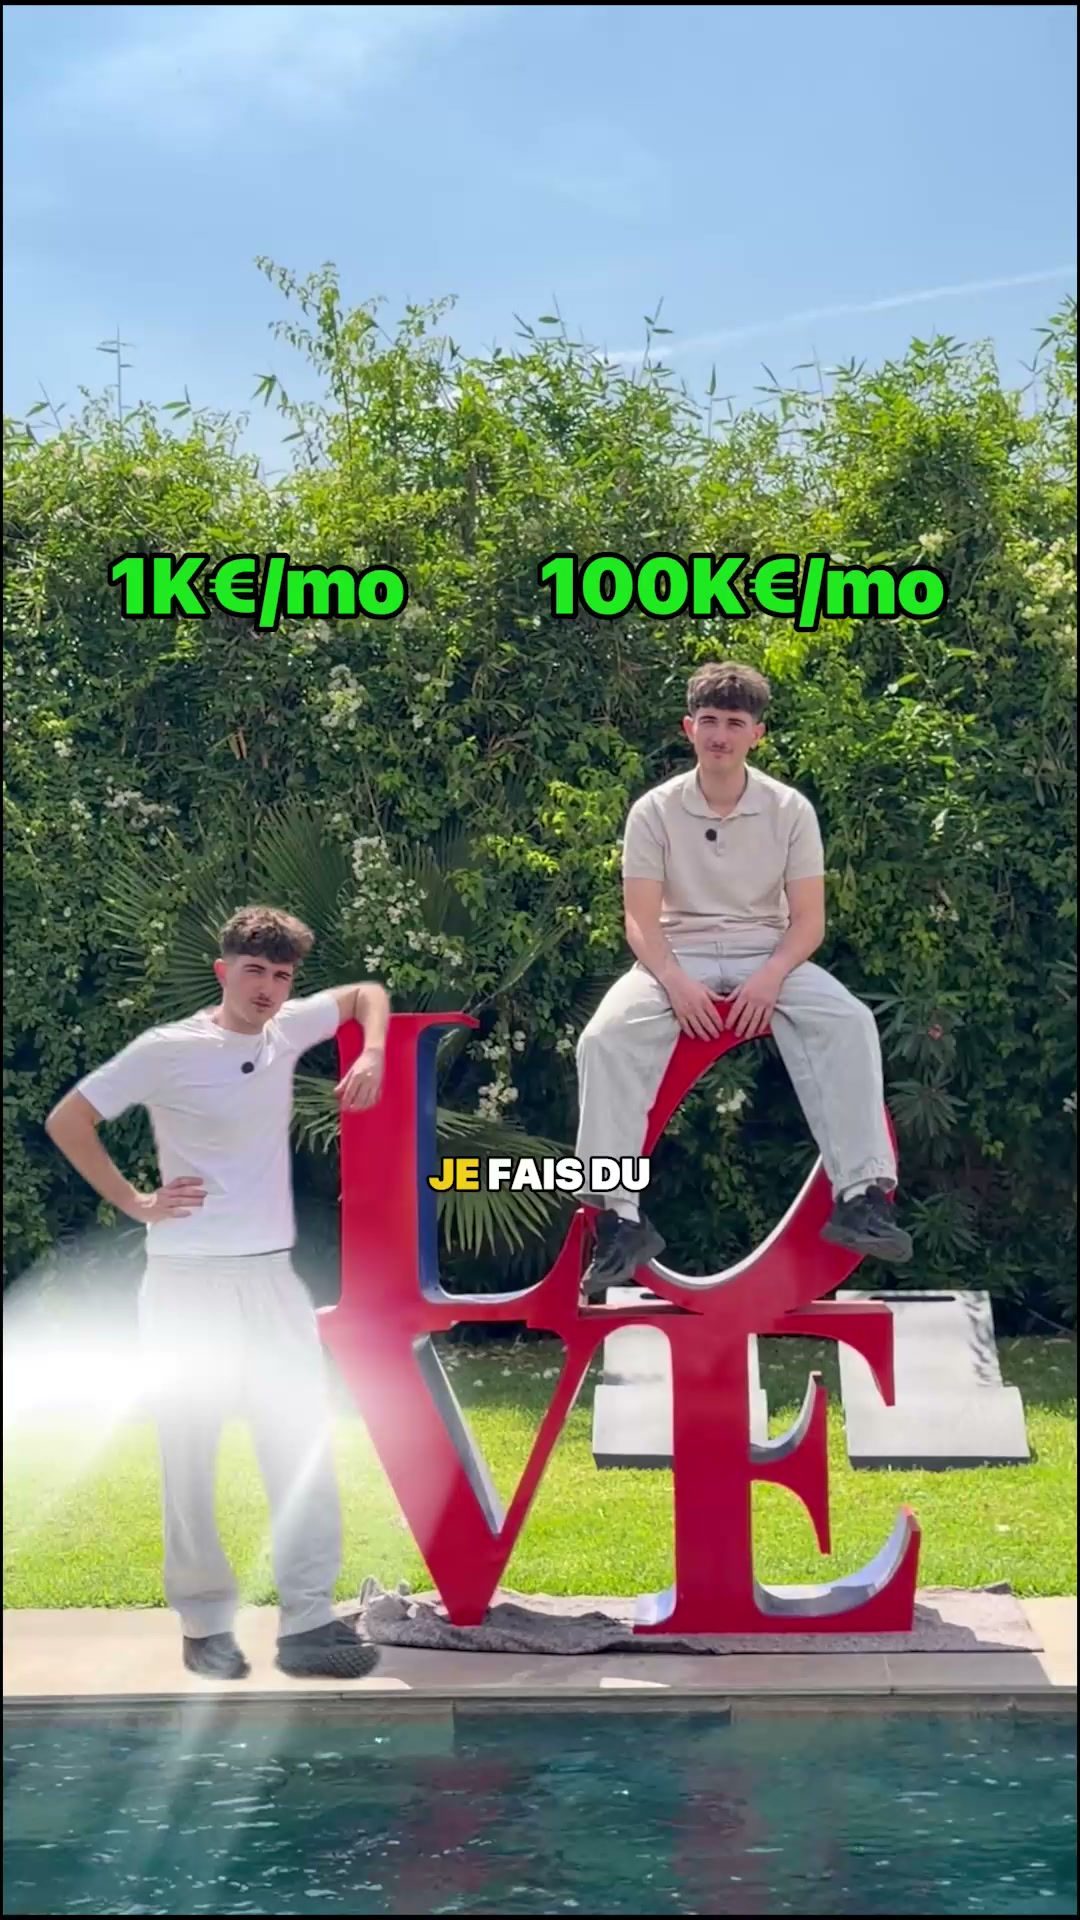
Two young men are shown outdoors, one standing and one sitting on a large red "LOVE" sculpture. Text overlays compare "1K €/mo" with "100K €/mo". The video shows various icons and text related to online business and trends, such as a parachute with a box, a clock, a TikTok logo, and a Google Trends logo, suggesting a comparison of business strategies or outcomes. The overall impression is a visual representation of different income levels achieved through online ventures.
Active · 30 daysVideo
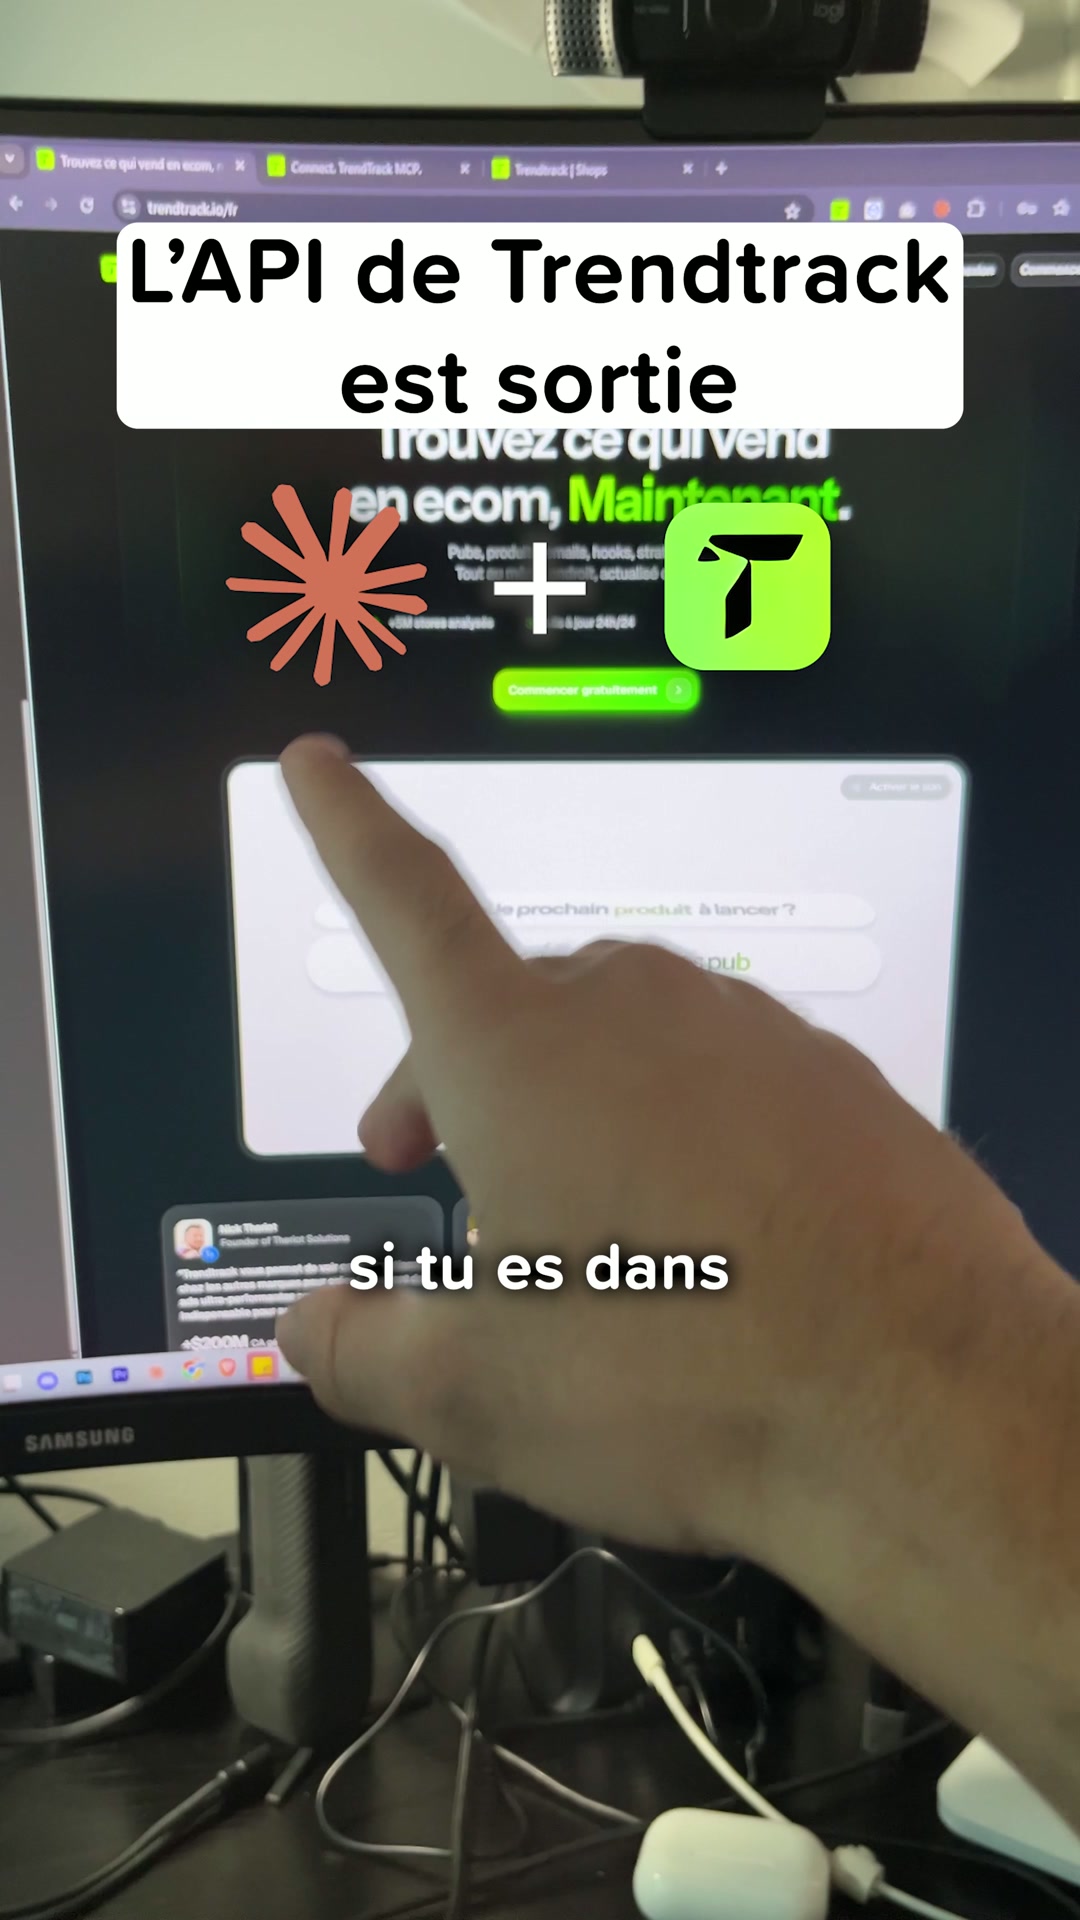
The video shows a screen recording of a computer monitor, demonstrating how to connect Trendtrack's API to Claude. It begins with a title card and then navigates through the Trendtrack website and Claude's interface, explaining each step. The creator points to different elements on the screen to guide the viewer through the process of adding a custom connector. The video concludes with a demonstration of asking Claude a question using the connected Trendtrack data.
Active · 30 daysVideo
A creator is in a car, talking to the camera. The video then shows a laptop screen with a website explaining how to connect Trendtrack to Claude. The creator demonstrates the process of adding a custom connector and then uses it to ask Claude for a product research report. The report shows winning products, competitor analysis, and creative ideas. The creator explains the value of this data for their brand or niche.
Active · 30 daysVideo
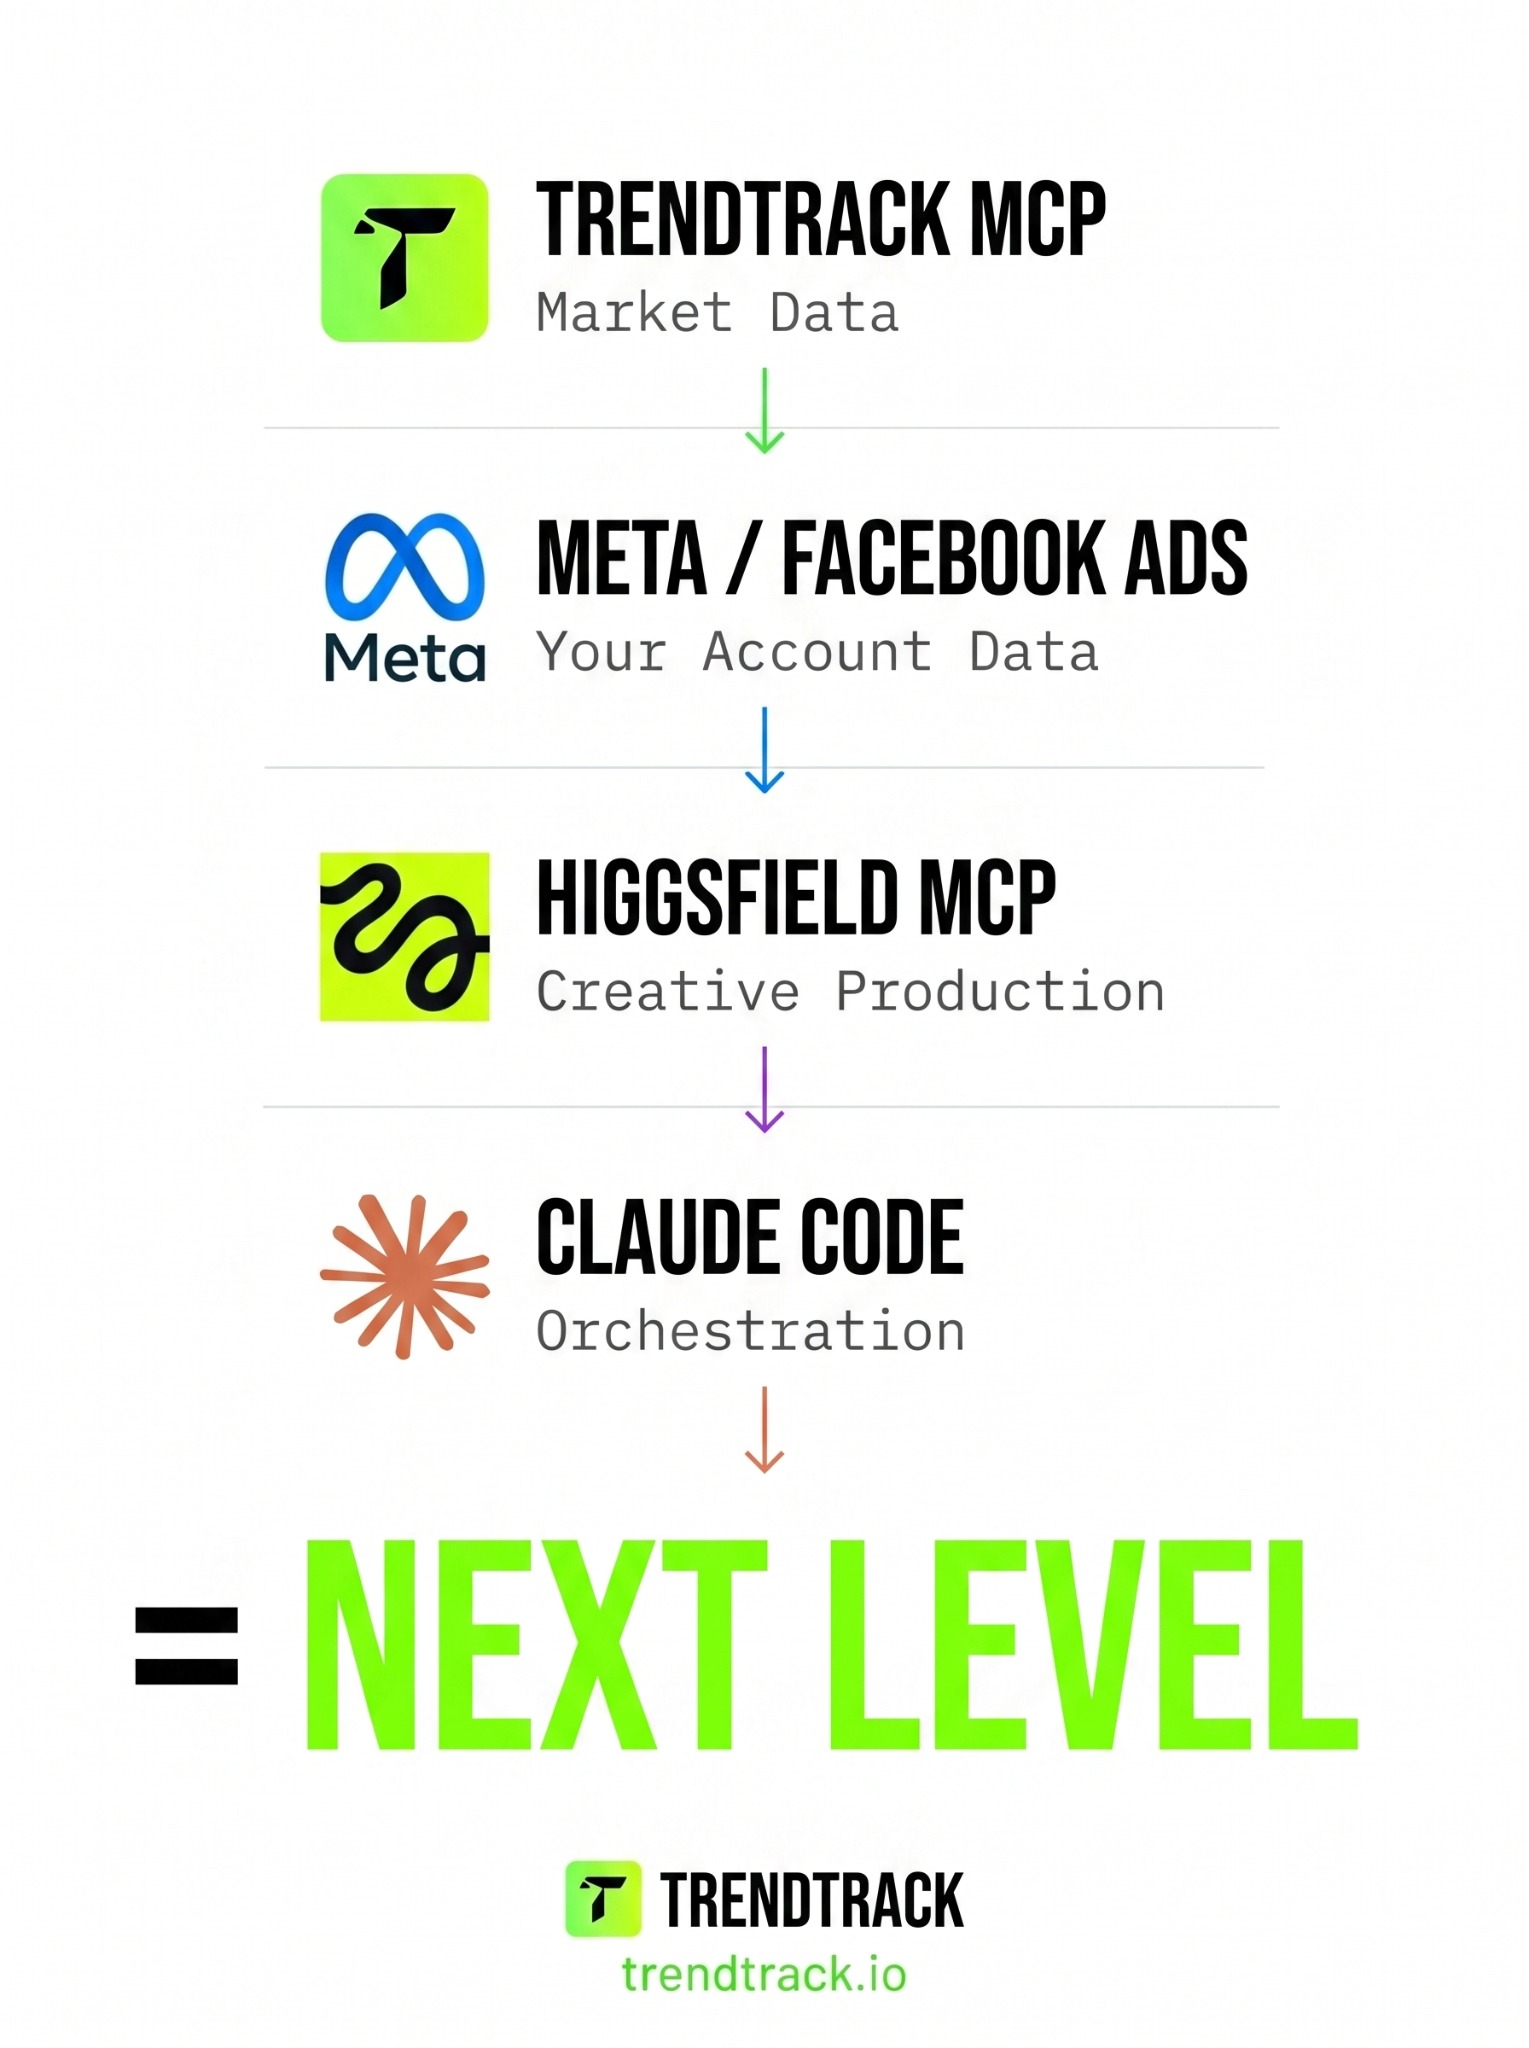
A vertical infographic showing a four-step workflow process. Each step features a brand logo and a label describing the function, connected by downward arrows. The final line states that the combination of these steps equals the next level, followed by the brand name and website at the bottom.
Active · 30 days
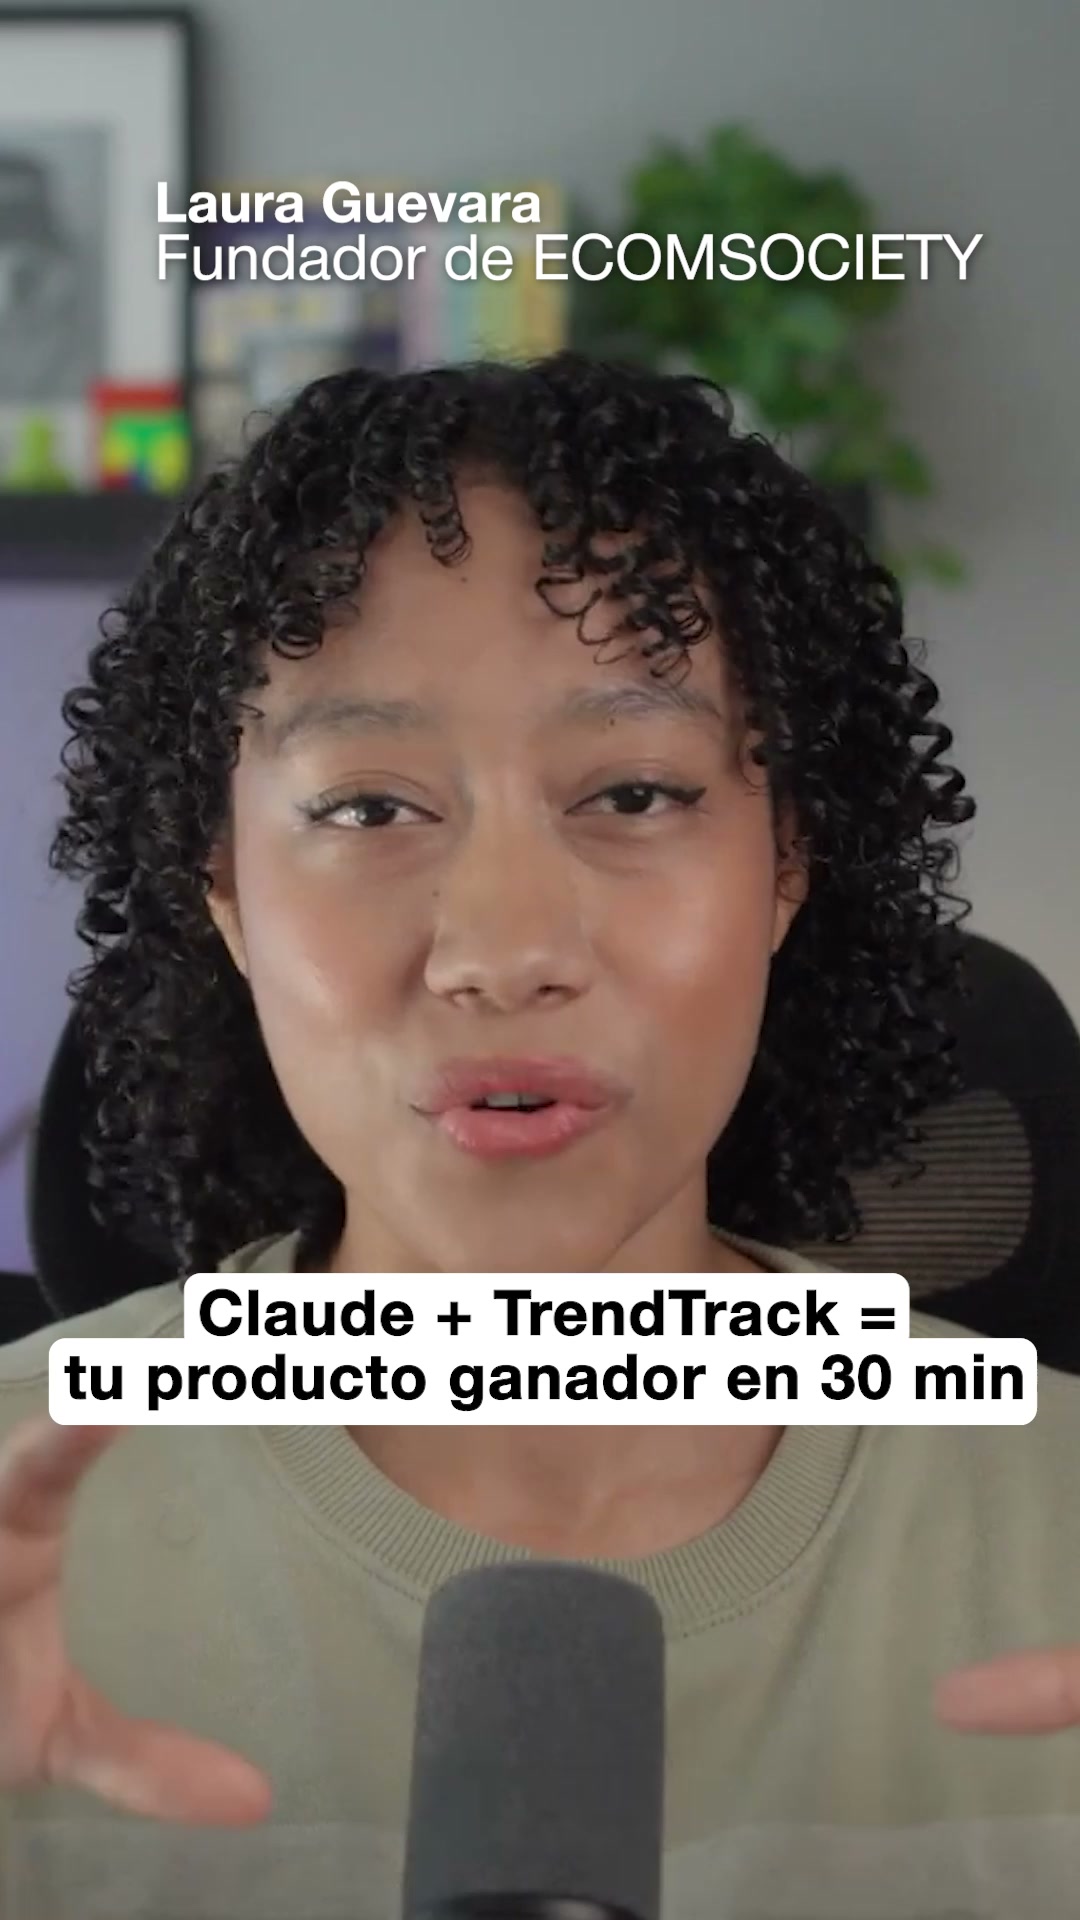
The video shows a woman, identified as Laura Guevara, founder of ECOMSOCIETY, explaining how to connect TrendTrack to Claude. She navigates through the Claude interface, demonstrating how to add a custom connector. The screen recording shows the process of inputting the TrendTrack API URL and adding it as a connector. Finally, she shows how to prompt Claude to use TrendTrack for market research.
Active · 30 daysVideo
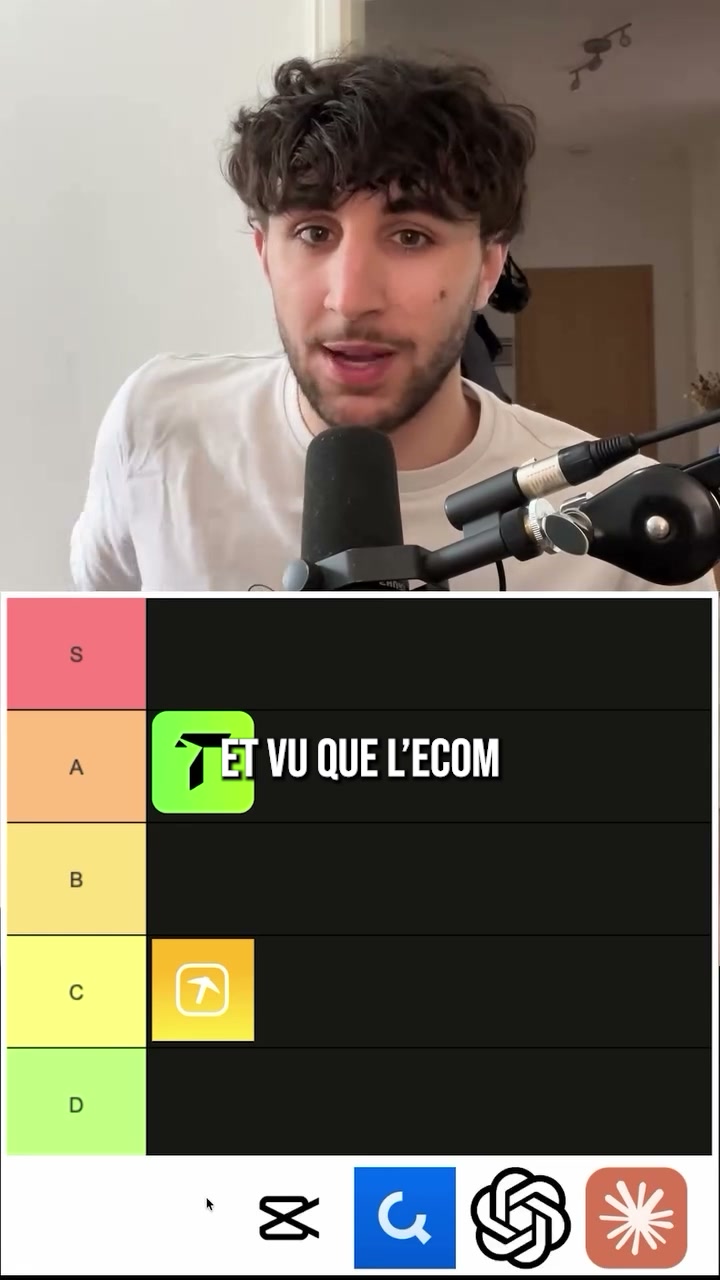
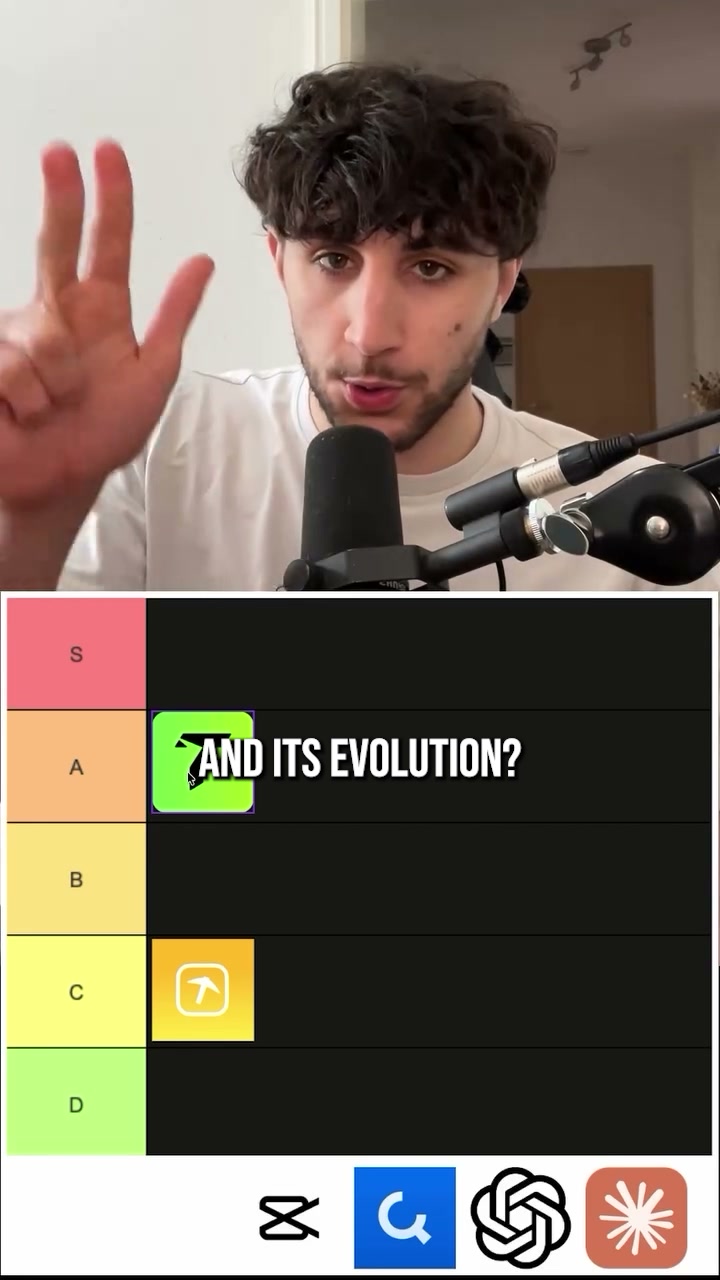
A tier list graphic is shown with the title "TIER LIST DES MEILLEURES APPS E-COM". The video features a man speaking, but he is not the focus. The graphic displays categories S, A, B, C, and D. Several app icons are shown at the bottom of the screen. The video progresses through different apps and ranks them, discussing their utility for e-commerce businesses.
Active · 30 daysVideo
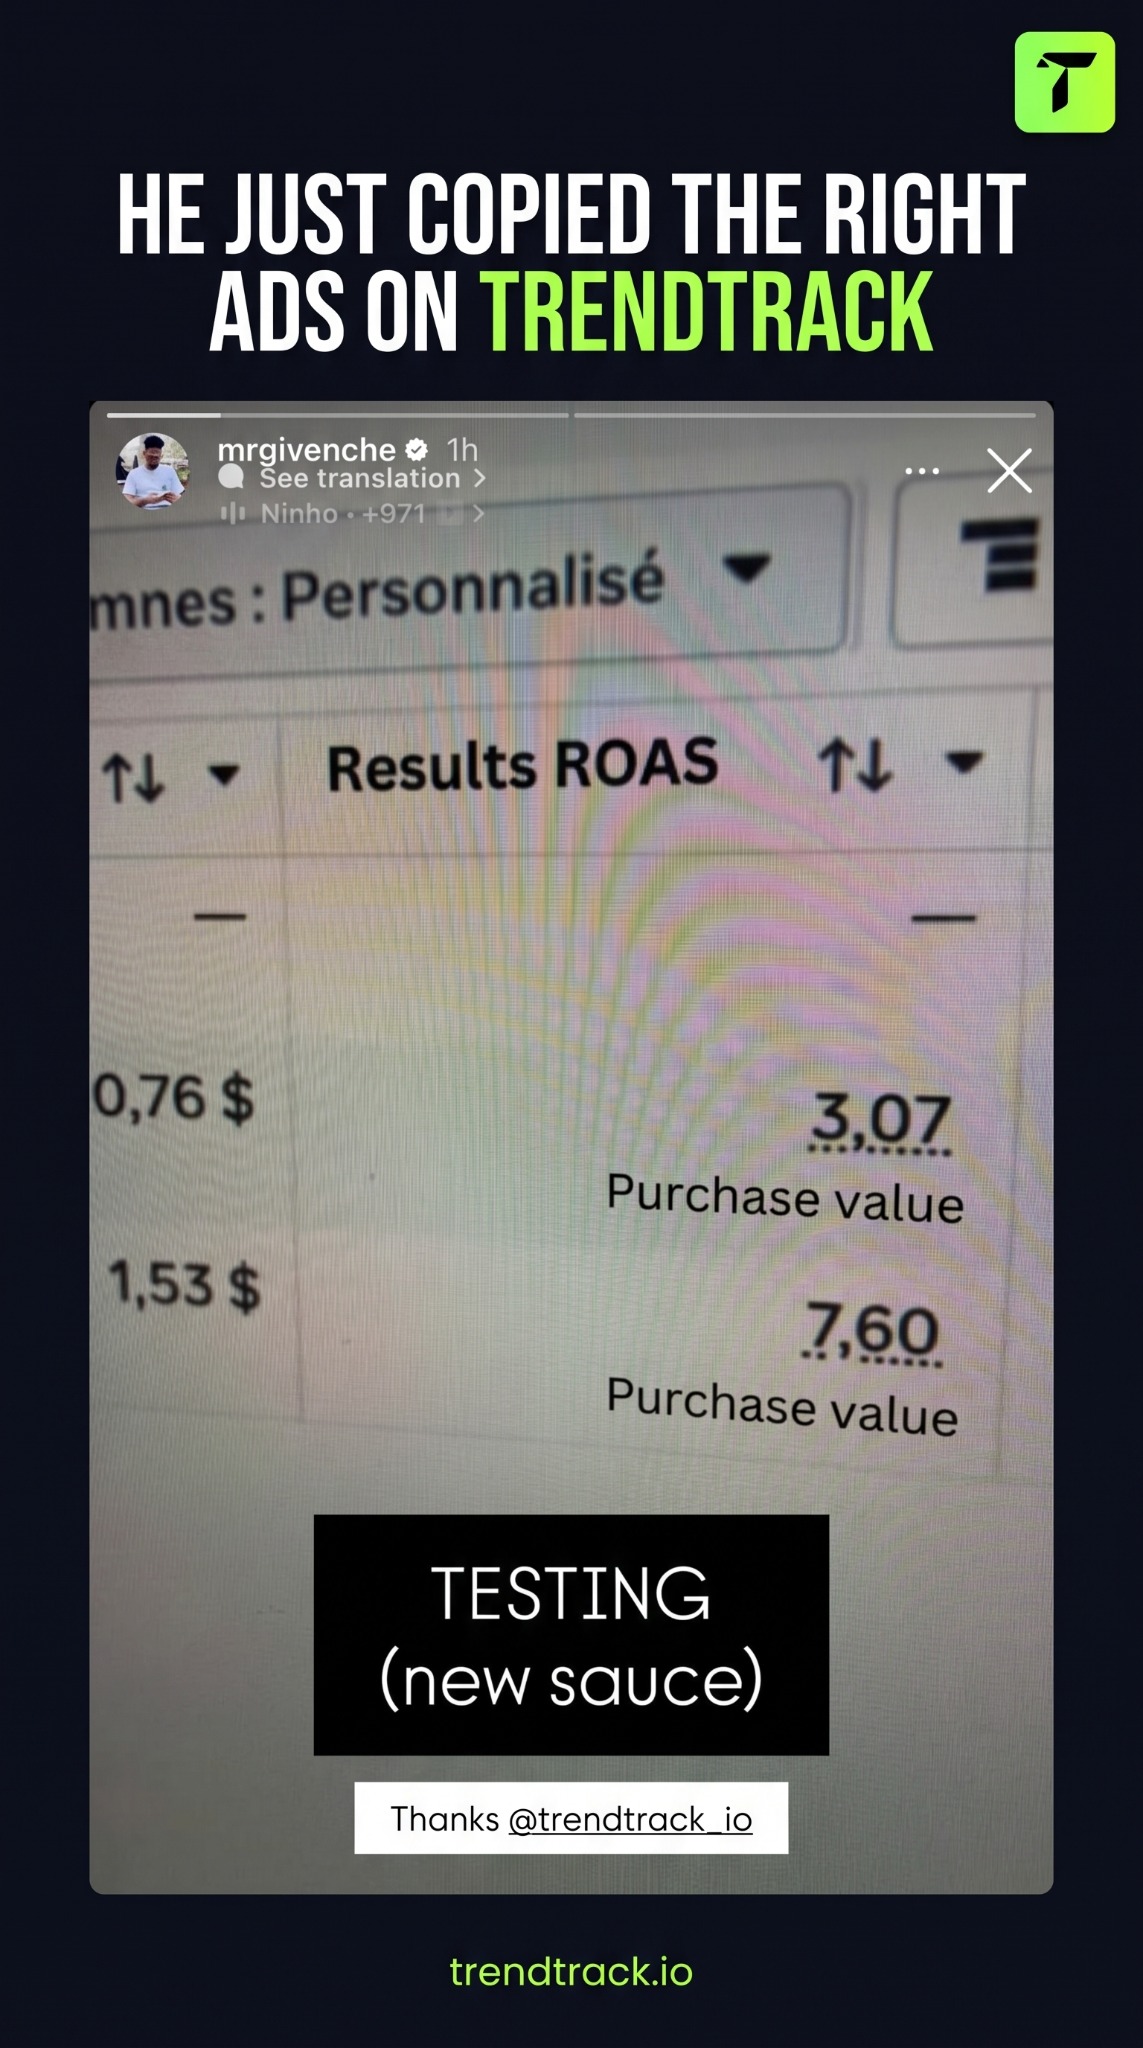
The ad features a screenshot of a digital dashboard showing advertising performance metrics like ROAS and purchase values. A black text box with white text is overlaid on the bottom of the screen, and a small white box with a brand handle is placed below that. The main headline is positioned at the top of the image against a dark background.
Active · 30 days
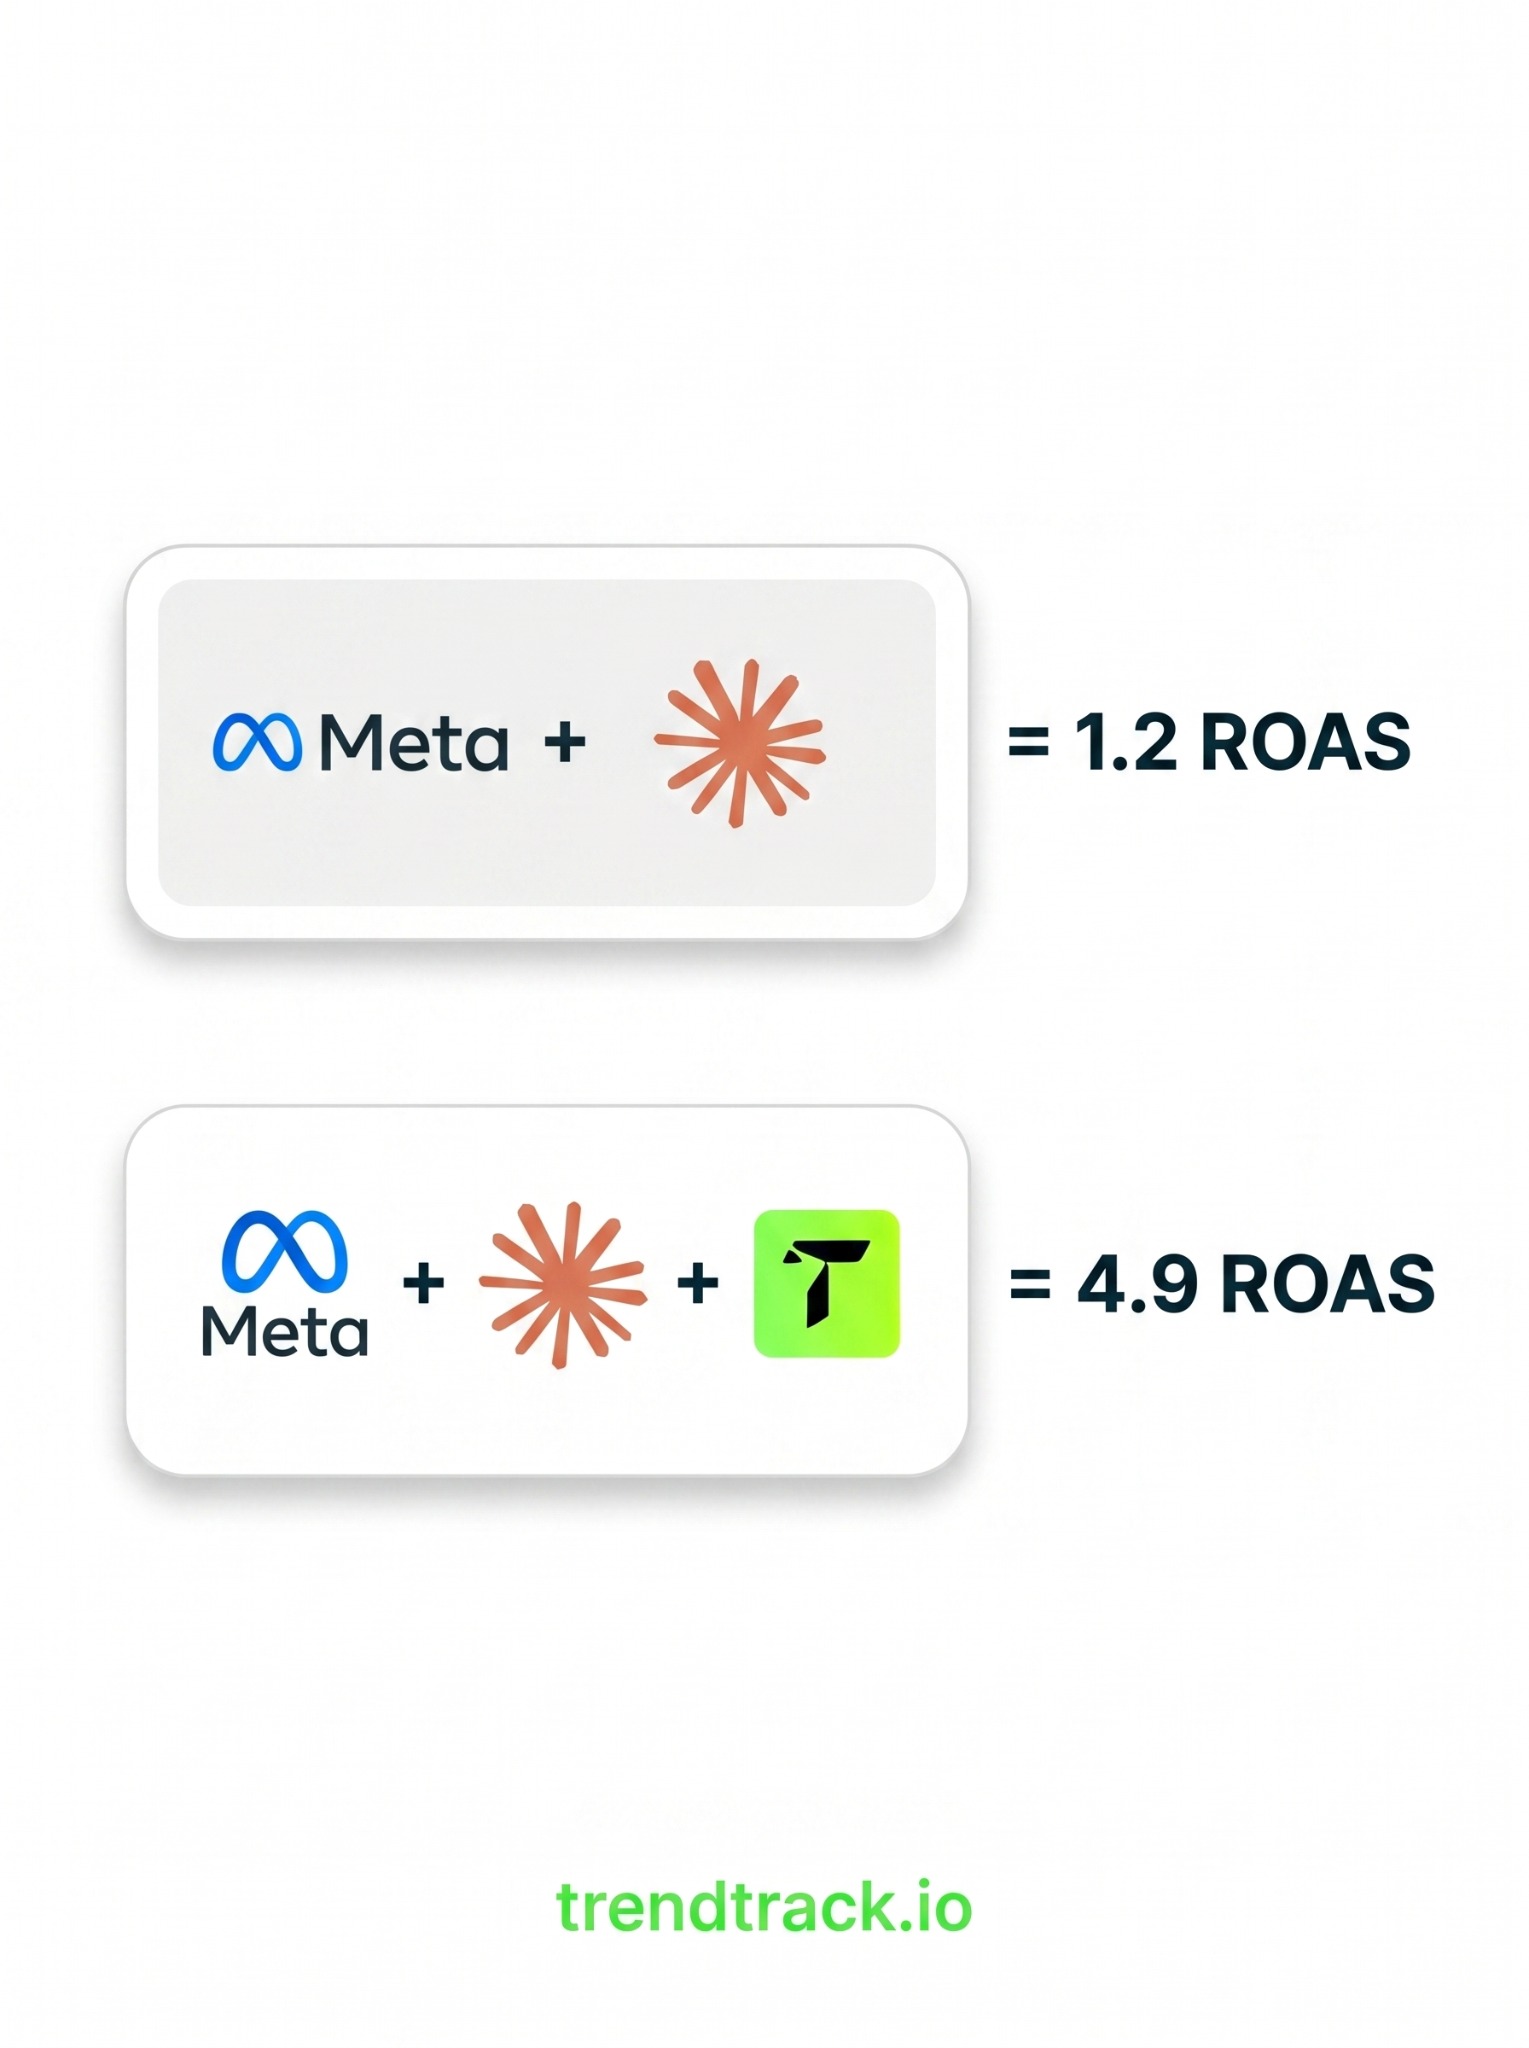
The creative is a clean, white-background graphic comparing two marketing scenarios. The top section shows a Meta logo plus an orange starburst icon resulting in 1.2 ROAS. The bottom section shows the same Meta logo and starburst icon, but adds a green T icon, resulting in 4.9 ROAS. The brand name appears at the very bottom.
Active · 30 days
A man is shown in front of a tier list graphic, discussing e-commerce apps. The video features text overlays that rank and describe various applications, focusing on their utility for product research and market analysis. The creator places apps into different tiers, explaining the reasoning behind each placement.
Active · 14 daysVideo
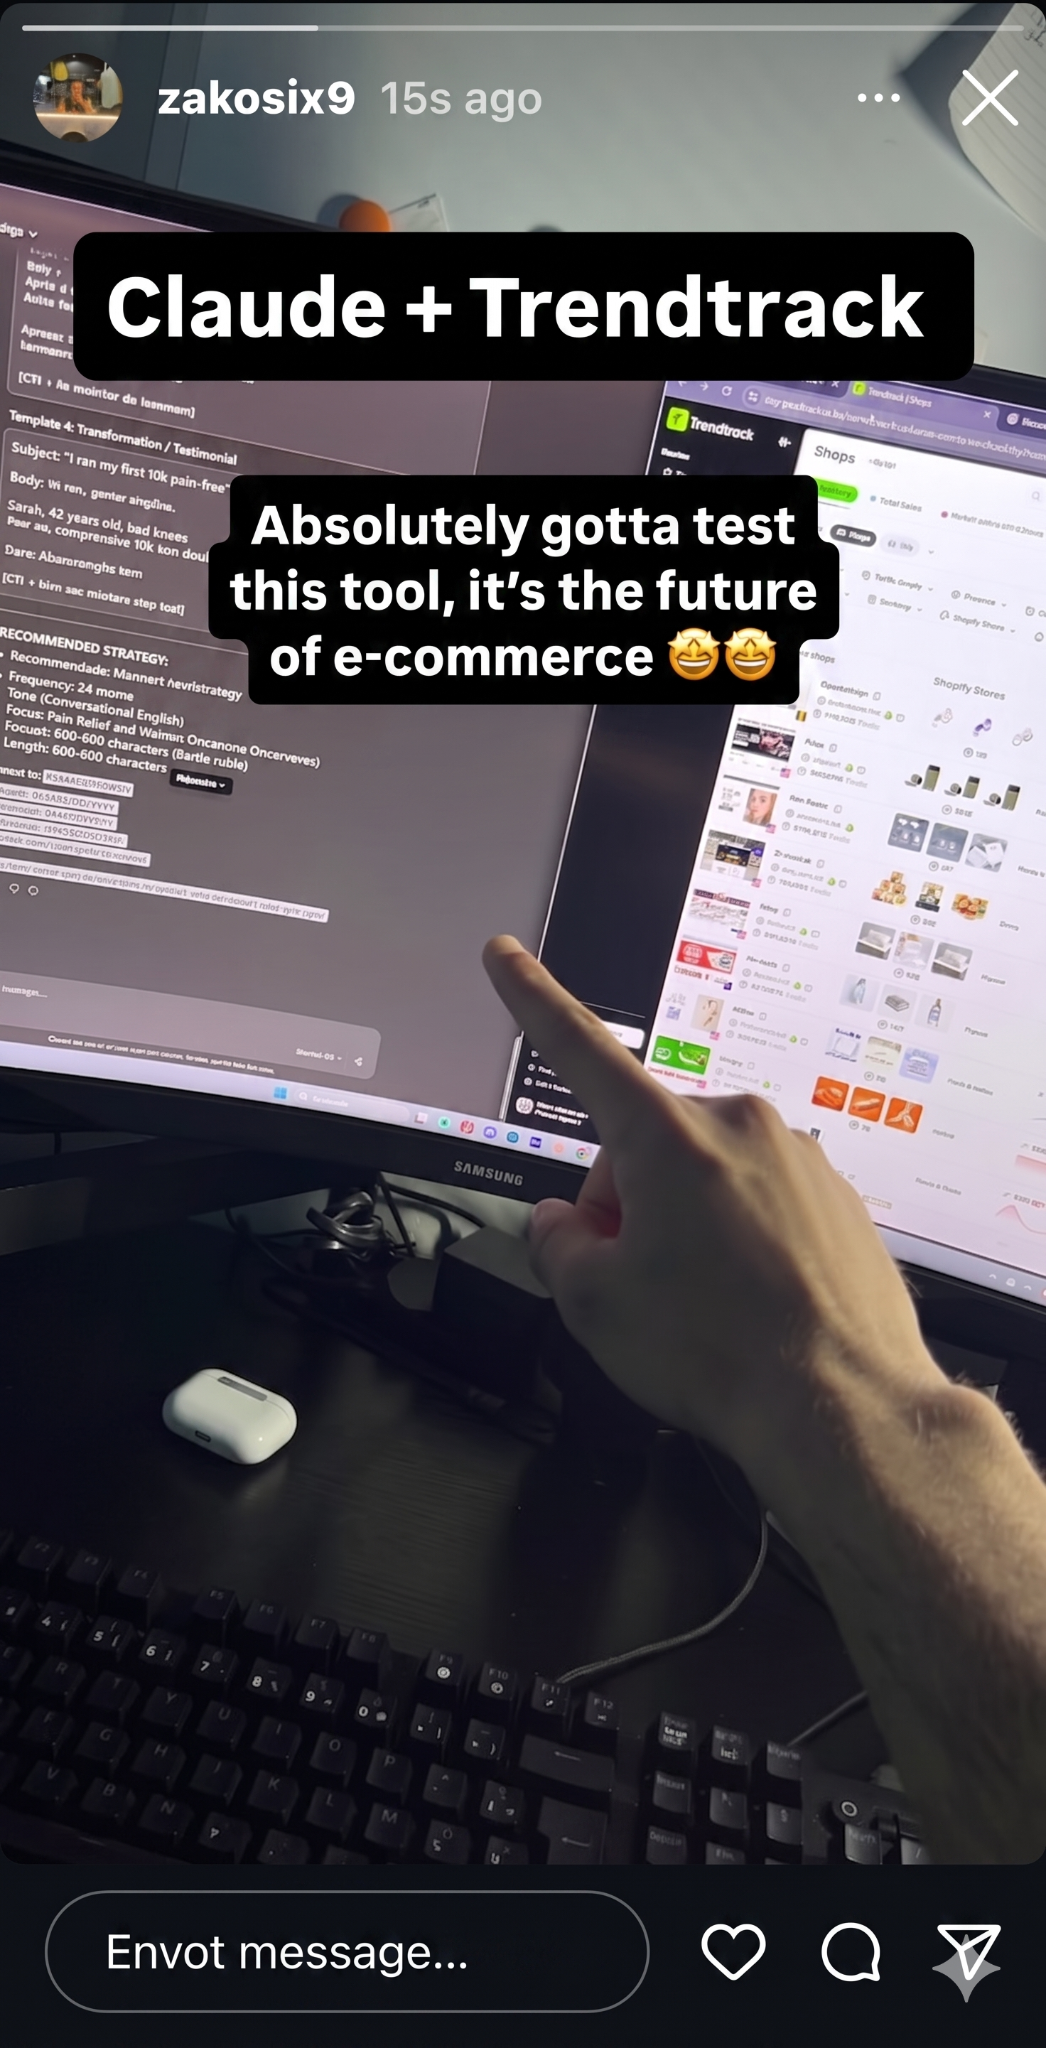
A first-person perspective shows a hand pointing at a computer monitor displaying a software dashboard. Two black text boxes with white text are overlaid on the screen. The top box reads 'Claude + Trendtrack' and the bottom box reads 'Absolutely gotta test this tool, it's the future of e-commerce'.
Active · 6 days

How Trendtrack.io makes its ads

What its ads are built from, by type, counted over the ads we have read.

What Trendtrack.io's ads are built from: who is in frame, the words, the structure, the top format and hook.

Card needed, $0 today. Cancel within 7 days, pay nothing.

How Trendtrack.io advertises on Facebook and Instagram

The library holds 53 ads from Trendtrack.io in App / Software, and 182 running on its Meta pages now. Its most common visual formats are Text Overlay (26 ads), Graphic Overlay (13) and Screen Recording (13). Its ads most often open on Contrast (12 ads), Question (8) and Bold claim (7) hooks. Its ads stay up a median 6 days, 0.3× the App / Software median of 19 days.