
131 Infographic Style Ad Examples
Infographic style ads present information as a designed layout of icons, numbers, diagrams and labels. Swipe the layouts below, then read how to keep one legible.
Niche6 selected
Brand
SortNewest




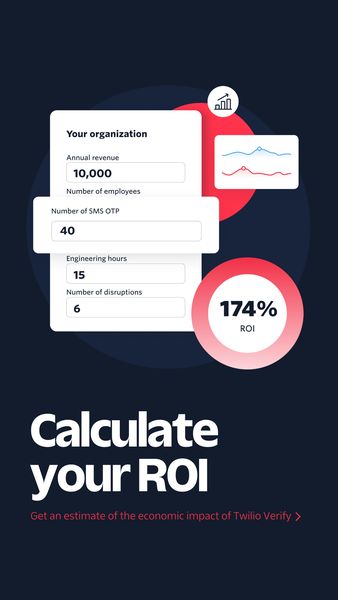




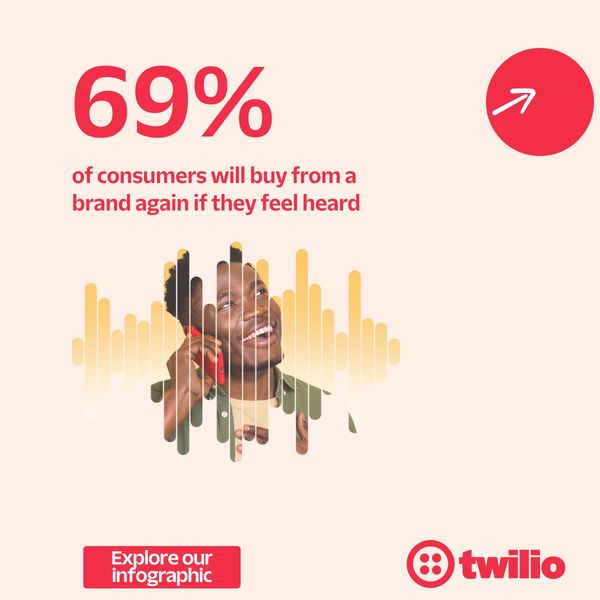




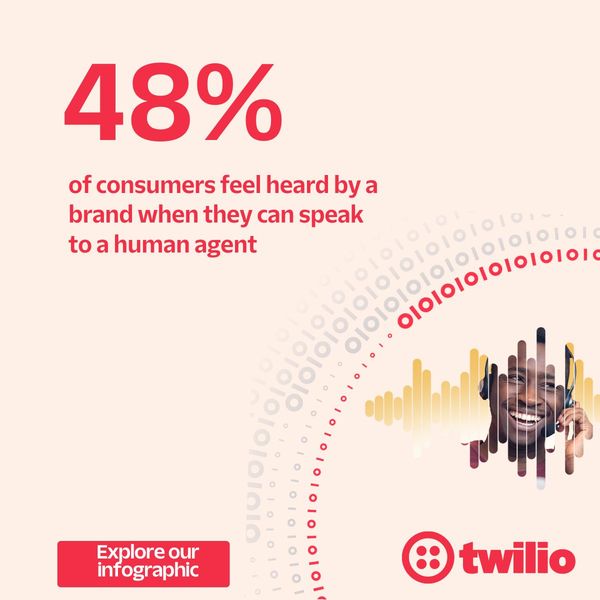


What are Infographic Style ads?
An infographic style ad organizes its message visually: sections, icons, arrows, charts, comparison tables, labelled product diagrams or a timeline. Instead of one photo and one line, the viewer gets a small map of information to scan. The format is usually static or a lightly animated carousel, and it relies on layout, hierarchy and consistent icons more than on photography or a person speaking.
When to use Infographic Style ads
- You have several facts, steps or ingredients that read more clearly as a structured layout than as a sentence.
- Your product needs a labelled breakdown, such as what is inside, how it fits together or how it differs from the usual option.
- You want a carousel that teaches something across cards, with one idea per swipe.
- You are selling to an audience that likes to be informed and may share or save a useful graphic.
- You lack strong photography or video and need a design-led creative that still looks deliberate.
Infographic Style ad best practices
Give the layout a clear reading order
Decide where the eye starts and where it ends. A big headline, then a few evenly spaced sections, then the call to action works better than elements scattered at equal weight.
Use one icon style throughout
Mixed icon sets look careless. Pick a single outline or fill style, one or two accent colors and a steady grid, so the graphic reads as one piece instead of a collage.
Cut the text to what must be said
An infographic is not a license for paragraphs. Use short labels and short numbers, and move the long explanation to the caption or landing page so the image stays easy to scan on a phone.
Show real numbers only when you can support them
Charts and figures look authoritative, so any claim in one should be accurate and, where needed, sourced. Avoid invented figures, and check platform rules for claims in sensitive categories.
Test the graphic at thumbnail size
View the finished creative at the size of a feed. If the headline or the key label cannot be read at a glance, simplify the design before spending on it.
Brands running Infographic Style ads
Niches with the most Infographic Style ads
Related formats
Related niches
Infographic Style ads: frequently asked questions
What is an infographic style ad?
It is an ad designed like an infographic, using icons, labels, charts and structured sections to present facts or steps. The viewer learns something by scanning the layout, which makes it a strong fit for products that need a short breakdown.
Are infographic ads better as static images or carousels?
Both are common. A single static image works when the idea fits one clear layout, while a carousel suits a sequence where each card carries one point. Pick the one that keeps the text large enough to read on a phone.
What goes wrong in infographic ads?
The usual problems are too much text, too many competing colors and elements that do not point to a clear starting place. Small type that disappears on a mobile screen is the most frequent issue, so simplify until a quick glance still works.
How is an infographic style ad different from a listicle ad?
A listicle ad is organized by a number of items and may be plain text on a background. An infographic style ad is organized by visual structure, such as icons and diagrams, and does not need a count. A design can be both.
Where can I find infographic ad examples and templates?
The gallery above collects infographic style ads from real brands, newest first when signed out, with the first 100 ads of every list open to free accounts. Treat it as a swipe file for layouts, icon choices and ways to structure information.